
Image
|
Figure Caption
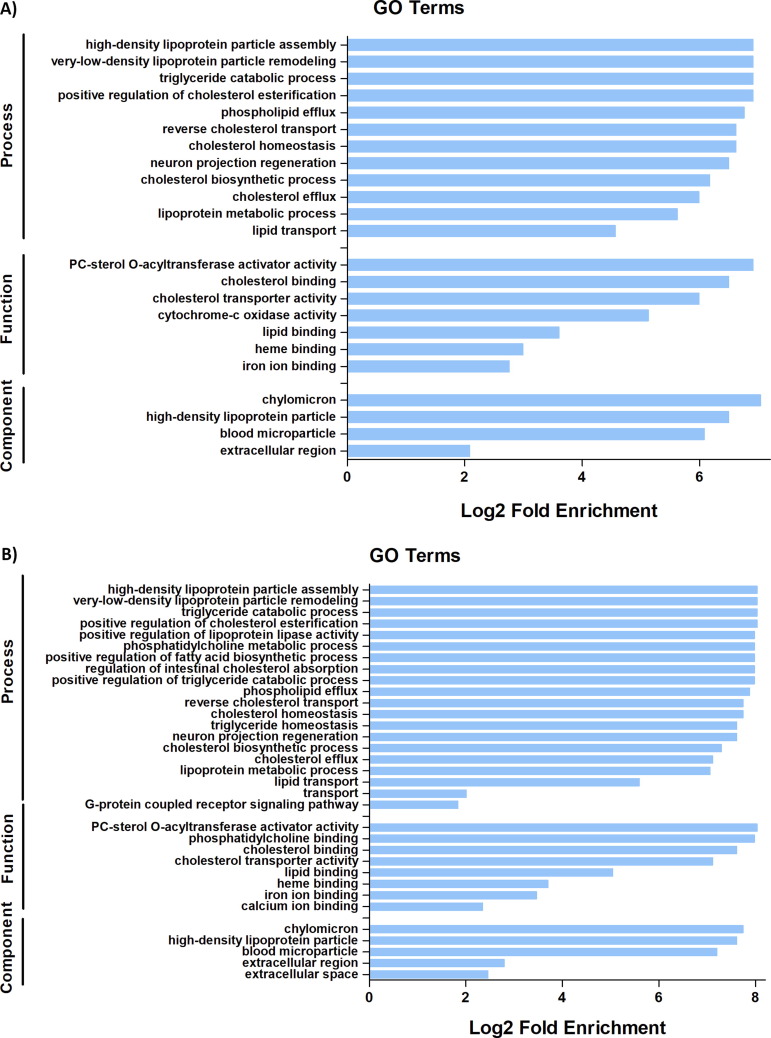
Fig. 2 Fig. 2. GO enrichment analysis and functional characterization of differentially regulated genes. Analysis of overrepresented GO Terms for (A) morphine and (B) cocaine exposure. GO Terms have been classified based on the three categories (Biological Process, Function, or Location Component), and the Log2 Fold enrichment value is represented on the x-axis.
Acknowledgments
This image is the copyrighted work of the attributed author or publisher, and
ZFIN has permission only to display this image to its users.
Additional permissions should be obtained from the applicable author or publisher of the image.
Full text @ Neuroscience