
|
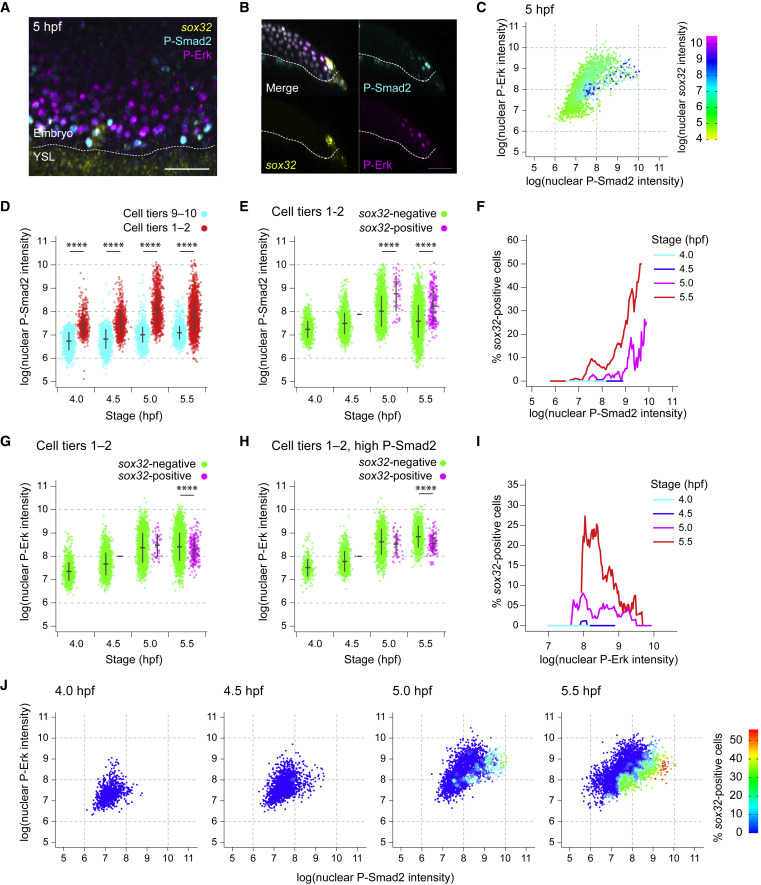
Fig. 3 Levels of Nodal and Fgf signaling are not deterministic for endoderm progenitor induction
(A) MIP through the margin of a 5-hpf embryo showing IF for P-Smad2 and P-Erk, with RNAscope for sox32. Dashed white line, embryo margin.
(B) Z-reconstruction through the lateral regions of the embryo in (A) showing sox32 expression in endodermal progenitors relative to P-Smad2 and P-Erk staining. Dashed white line, embryo margin.
(C) Scatter plot showing nuclear staining intensity of P-Smad2 and P-Erk for a single 5-hpf embryo. Cells colored by nuclear staining intensity for sox32.
(D) Plot showing P-Smad2 staining intensity for all cells in cell tiers 1–2 compared to background (cell tiers 9–10). Means ± SD are shown.
(E) Plot showing P-Smad2 staining intensity for all cells in cell tiers 1–2, sorted into sox32-positive and -negative cells. Means ± SD are shown.
(F) Traces showing the proportion of cells that are sox32-positive for a given P-Smad2 staining intensity for cells in cell tiers 1–2 at different stages. The proportion of sox32-positive cells for a given level of P-Smad2 staining is based on all cells within a window of ± 5% of the total range of P-Smad2 staining intensities for that stage.
(G) As in (E), but showing P-Erk staining intensity. Means ± SD are shown.
(H) As in (G), but showing P-Erk staining intensity for cells with P-Smad2 staining elevated above background levels. Means ± SD are shown.
(I) Traces showing the proportion of cells that are sox32-positive for a given P-Erk staining intensity for cells in cell tier 1–2 with elevated P-Smad2 staining (defined as in H) at different stages. Traces are as in (F). In (H and I), the 99th percentile of P-Smad2 staining intensity for the cells from the cell tiers 9–10 is used as a threshold to define elevated P-Smad2.
(J) Scatter plot showing nuclear staining intensity of P-Smad2 and P-Erk for cells in cell tiers 1–2 through time. Color coding indicates the proportion of cells for the given signaling profile which are sox32 positive. The data are a re-analysis of the data presented in panels F and I. Analyses in this figure are based on the dataset in Figure 2E.
See also Figure S3. Scale bars: 50 μm (A, B). ∗∗∗∗p < 0.0001.
Reprinted from Developmental Cell, 57, Economou, A.D., Guglielmi, L., East, P., Hill, C.S., Nodal signaling establishes a competency window for stochastic cell fate switching, 26042622.e52604-2622.e5, Copyright (2022) with permission from Elsevier. Full text @ Dev. Cell