
|
Fig. 6.
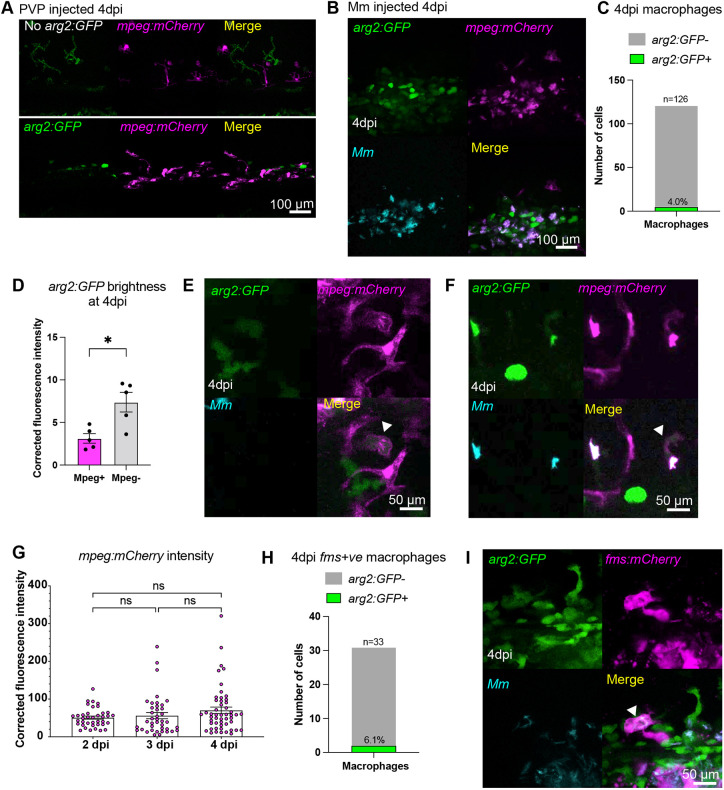
A subset of granuloma-associated macrophages express arg2:GFP. (A) Fluorescence confocal micrographs of 4 dpi (5 dpf) embryos [mpeg:mCherry line crossed to the wild-type line (no arg2:GFP) or arg2:GFP line] after PVP control injection at 1 dpf. Only pigment autofluorescence and ionocyte-specific expression of arg2:GFP is present. (B) Fluorescence confocal micrographs of 4 dpi (5 dpf) embryos (arg2:GFP line crossed to the mpeg:mCherry line) after Mm infection at 1 dpf. (C) Graphs showing the percentage of arg2:GFP-positive and -negative granuloma-associated macrophages at 4 dpi (5 dpf). Data shown are from n=126 cells from 15 larvae accumulated from three independent experiments. (D) Corrected fluorescence intensity of arg2:GFP in mpeg:mCherry-positive macrophages compared to that in cells with immune morphology that were mpeg:mCherry negative at 4 dpi (5 dpf). Data shown are from n=12 larvae accumulated from three independent experiments. The P-value was calculated using unpaired two-tailed t-test. *P<0.05. (E) Fluorescence confocal micrographs of 4 dpi (5 dpf) embryos (arg2:GFP line crossed to the mpeg:mCherry line) after Mm infection at 1 dpf showing a non-infected, arg2:GFP-positive macrophage (arrowhead). (F) Fluorescence confocal micrographs of 4 dpi (5 dpf) embryos (arg2:GFP line crossed to the mpeg:mCherry line) after Mm infection at 1 dpf showing an infected, arg2:GFP-positive macrophage (arrowhead). (G) Corrected fluorescence intensity of mCherry in mpeg:mCherry-positive macrophages at 2, 3 and 4 dpi (3, 4 and 5 dpf, respectively) after Mm infection at 1 dpf. Data shown are from n=10-12 larvae. The P-value calculated using a one-way ANOVA (with Bonferonni post-test adjustment). ns, not significant. (H) Graph showing the percentage of arg2:GFP-positive and -negative granuloma-associated macrophages marked with Tg(fms:Gal4.VP16)i186;Tg(UAS:nfsB.mCherry)i149 (fms:mCherry) expression, at 4 dpi (5 dpf). Data shown are from n=33 cells accumulated from two independent experiments. (I) Fluorescence confocal micrographs of 4 dpi (5 dpf) embryos (arg2:GFP line crossed to the fms:mCherry line) after Mm infection at 1 dpf, showing an arg2:GFP-positive macrophage (arrowhead).