
|
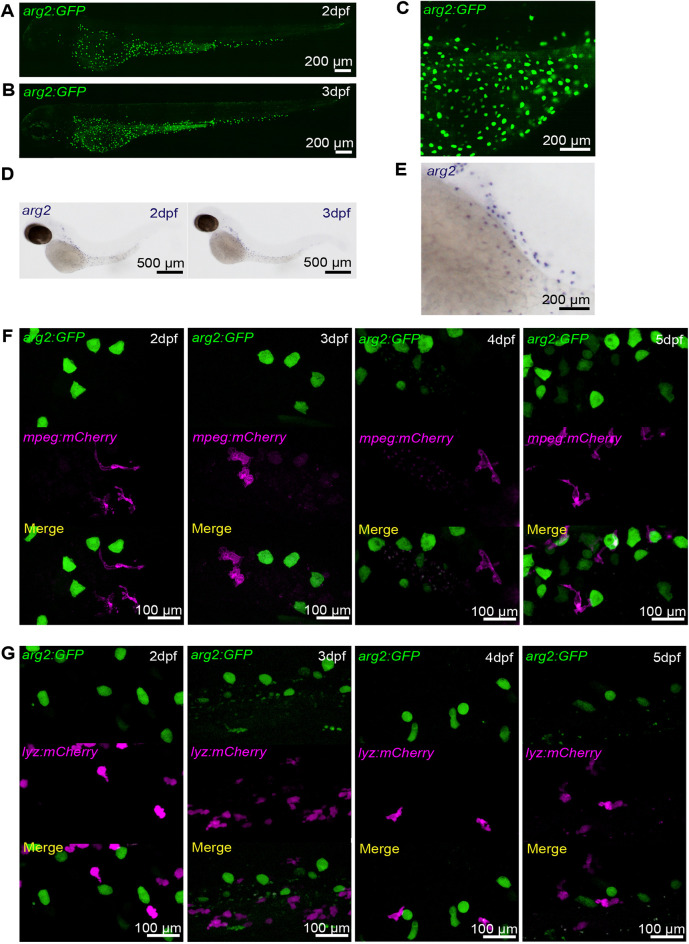
Fig. 1.
The TgBAC(arg2:eGFP)sh571 line shows GFP expression in ionocytes but not in resting macrophages and neutrophils, recapitulating the arg2 in situ hybridisation expression pattern. (A,B) Light-sheet microscopy stereo micrographs of the TgBAC(arg2:eGFP)sh571 (arg2:GFP) line shows ionocyte-specific expression at 2 dpf (A) and 3 dpf (B). (C) Enlarged image of the section over the yolk of B. (D) arg2 in situ hybridisation shows expression in cells over the yolk known as ionocytes at 2 and 3 dpf in unchallenged zebrafish (n=15/15 larvae accumulation over three independent experiments). (E) Enlarged image of the section over the yolk of 3 dpf larvae in D. (F) Stereo fluorescence micrograph of the arg2:GFP line crossed to the Tg(mpeg1:mCherry)sh378 (mpeg:mCherry) line at 2, 3, 4 and 5 dpf, showing no overlap of arg2:GFP expression in ionocytes with mpeg:mCherry-positive (magenta) macrophages. Sixty larvae in total were screened for macrophage-specific arg2:GFP expression over three independent experiments. (G) Stereo fluorescence micrograph of the arg2:GFP line crossed to the Tg(lyz:nfsB.mCherry)sh260 (lyz:mCherry) line at 2, 3, 4 and 5 dpf, showing no overlap of arg2:GFP expression in ionocytes with lyz:mCherry-positive (magenta) neutrophils. Sixty larvae in total were screened for neutrophil arg2:GFP expression over three independent experiments.