
Image
|
Figure Caption
Fig. 4
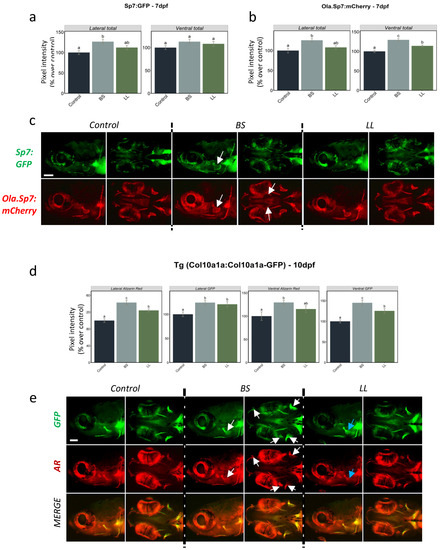
Figure 4. Integrated pixel intensity values for various areas measured in 7 dpf zebrafish from (a) Tg(sp7:sp7-GFP) and (b) Tg(Ola.Sp7:mCherry) larvae in controls and upon two different probiotic treatments. (c) Signal expression images (lateral and ventral views) of the head area of Tg(sp7:sp7-GFP) and Tg(Ola.Sp7:mCherry) larvae under the different conditions. (d) Integrated pixel intensity values for various areas measured in 10 dpf Tg(col10a1a:col10a1a-GFP) zebrafish larvae from the different treatment groups and stained with AR. (e) GFP, AR fluorescence and merged images of the head area (lateral and ventral views) of Tg(col10a1a:col10a1a-GFP) larvae from the different treatment groups. Increased GFP and AR fluorescence in various bony structures are denoted by white and blue arrows, respectively, in BS- and LL-treated fish. One-way ANOVA and Tukey’s multiple comparison tests are used, and statistical significance was set at p < 0.05. Different letters denote statistically significant differences between experimental groups. The scale bars, given in the left bottom corner of the first image in the top row, correspond to 100 µm.
Figure Data
Acknowledgments
This image is the copyrighted work of the attributed author or publisher, and
ZFIN has permission only to display this image to its users.
Additional permissions should be obtained from the applicable author or publisher of the image.
Full text @ Int. J. Mol. Sci.