
Image
|
Figure Caption
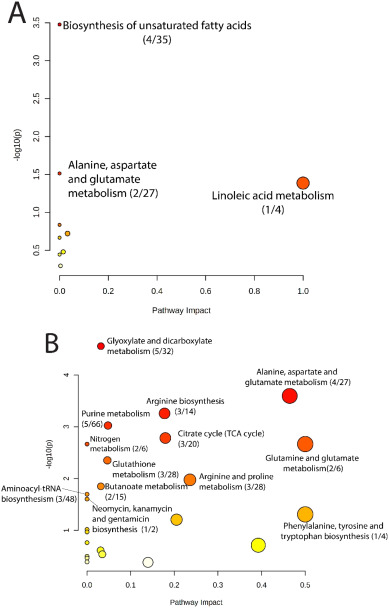
Fig. 3 Pathway analysis of A) 6-OH-BDE47 0.1 μM exposure B) OH-PBDE Mix 0.03 μM exposure. Pathways significantly affected (p < 0.05) are labelled with their name. The numerator in the fraction associated with each labelled pathway represents the number of significantly affected metabolites in that particular pathway and the denominator shows the total number of metabolites present in the pathway. The nodes have a continues colour gradient from yellow to red where yellow nodes indicate higher p-value and red nodes indicate lower p-value. A larger size of the node indicates higher pathway impact.
Acknowledgments
This image is the copyrighted work of the attributed author or publisher, and
ZFIN has permission only to display this image to its users.
Additional permissions should be obtained from the applicable author or publisher of the image.
Full text @ Sci. Total Environ.