
|
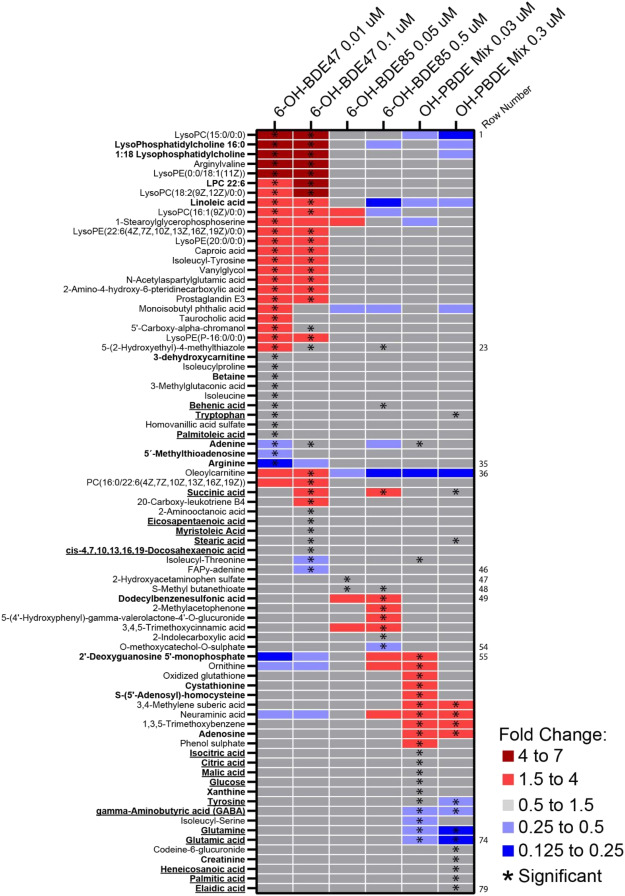
Fig. 2 Heat map illustrating fold changes of metabolites that were significantly different from the solvent control in at least one exposure. Metabolite names in bold have been annotated at confidence level 1 or 2 and non-bold metabolites have been annotated at confidence level 3. Underlined metabolites have been quantified using authentic reference standards and internal standards. The metabolites are ordered with the significant metabolites for 6-OH-BDE47 0.01 μM on top, followed by the significant metabolites for 6-OH-BDE47 0.1 μM and so on from left to right. Within each exposure group, the metabolites are ordered according to fold change with the highest fold change on top.