
Image
|
Figure Caption
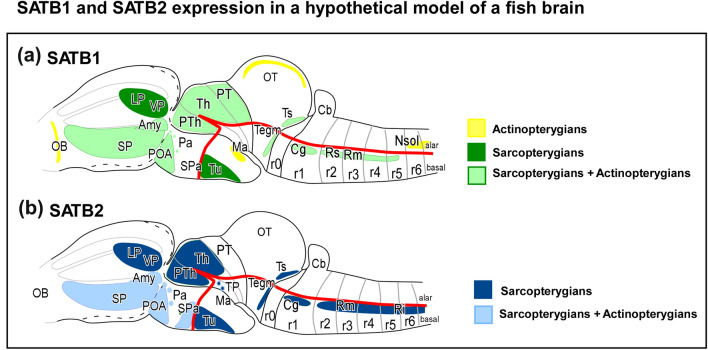
Fig. 10
Schematic representation of SATB1 (A) and SATB2 (B) expression patterns in a model vertebrate. The schemes represent the main regions of expression found in the present study. The particular exceptions have not been included for simplicity but are detailed in the text and in Table Table3.3. The correspondence of the color code is indicated on the right. The anatomical representation does not correspond to any particular model. See list for abbreviations
Acknowledgments
This image is the copyrighted work of the attributed author or publisher, and
ZFIN has permission only to display this image to its users.
Additional permissions should be obtained from the applicable author or publisher of the image.
Full text @ Brain Struct. Funct.