
Figure 2
- ID
- ZDB-IMAGE-230502-3
- Genes
- Publication
- Kondo et al., 2023 - The sinusoidal hematopoietic niche is formed by Jam1a via Notch signaling in the zebrafish kidney
- All Figures
- Figures for Kondo et al., 2023
|
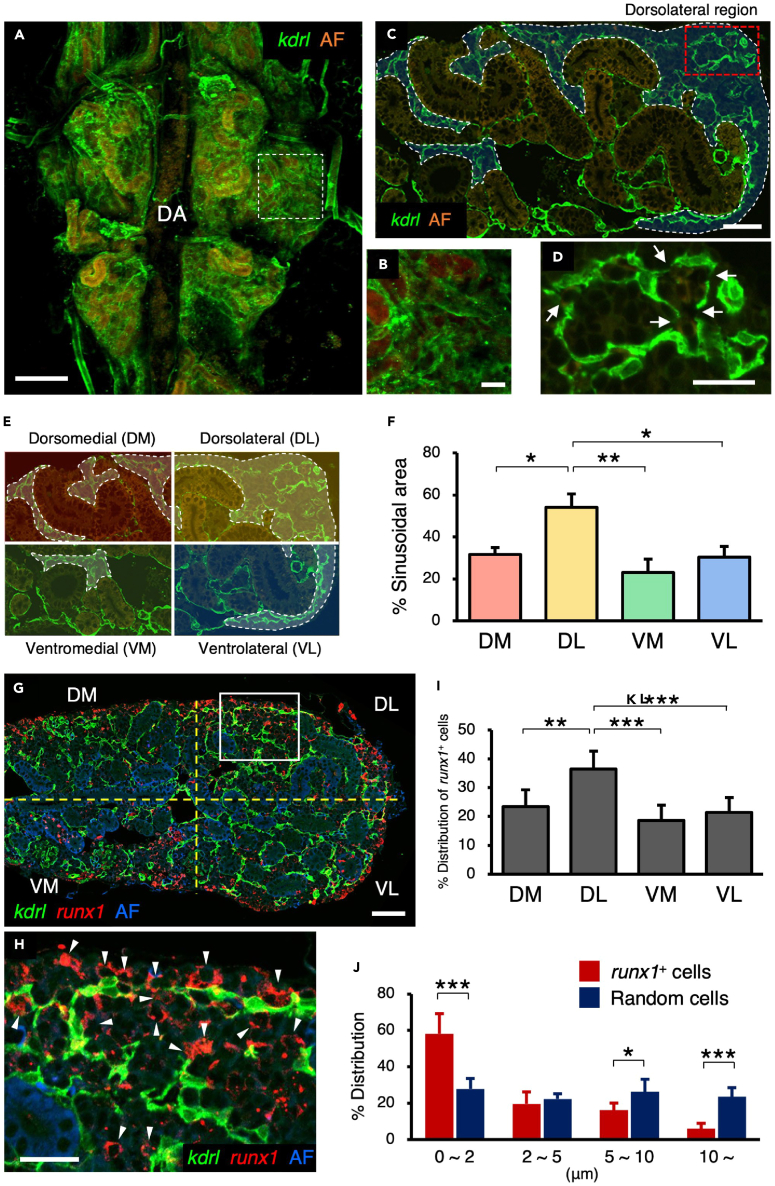
Figure 2
Sinusoids are formed in the dorsolateral region of the kidney
(A and B) Dorsal view of a kdrl:Cerulean kidney. A high magnification view of the white dotted area is shown in B.
(C and D) Transverse section of a kdrl:Cerulean kidney. Blue areas outlined by the white dotted line denote the sinusoidal area. A high magnification view of the red dotted area is shown in D. Arrows indicate the fenestra in the sinusoidal endothelium.
(E and F) Quantification of sinusoidal area in the kidney. Kidney tissue was subdivided into 4 regions, dorsomedial (DM), dorsolateral (DL), ventromedial (VM), and ventrolateral (VL), and the percentage of sinusoidal area was quantified in each region (mean ± s.e.m; n = 6).
(G and H) Transverse section of a kdrl:Cerulean; runx1:mCherry kidney. A high magnification view of the white boxed area is shown in H. Arrowheads in H indicate runx1+ cells detected in the sinusoidal area. AF in A–C, G, and H denotes auto-fluorescence of renal tubules or erythrocytes.
(I and J) Percent distribution of runx1+ cells in each region (I) and distance (μm) of individual runx1+ cells or randomly selected cells from the kdrl:Cerulean+ sinusoidal endothelium (J) (total 904 runx1+ cells and 183 random cells from 4 zebrafish; error bars, s.d.). ∗p < 0.05; ∗∗p < 0.01; DA, dorsal aorta; Bars, 200 μm (A); 40 μm (B, C, G); 20 μm (D, H).