
Image
|
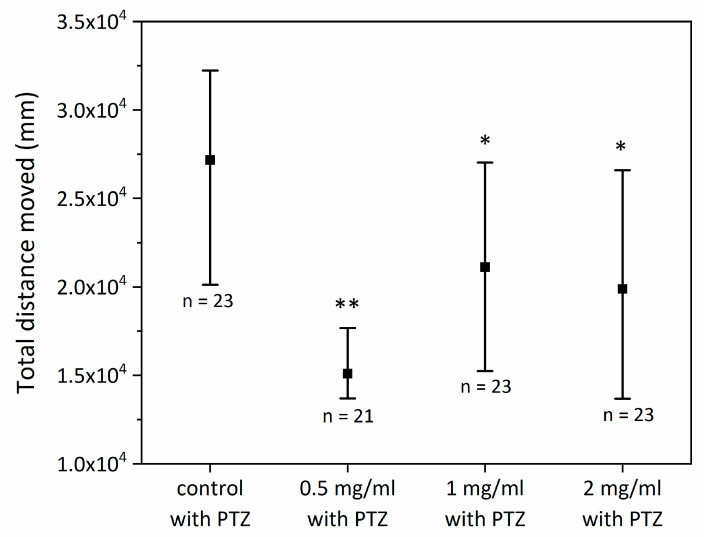
Figure Caption
Figure 3
Comparison of different groups exposed to PTZ in short-term exposure protocol. * p < 0.05 compared to control group; ** p < 0.0001 compared to control.
Figure Data
Acknowledgments
This image is the copyrighted work of the attributed author or publisher, and
ZFIN has permission only to display this image to its users.
Additional permissions should be obtained from the applicable author or publisher of the image.
Full text @ Int. J. Mol. Sci.