
Image
|
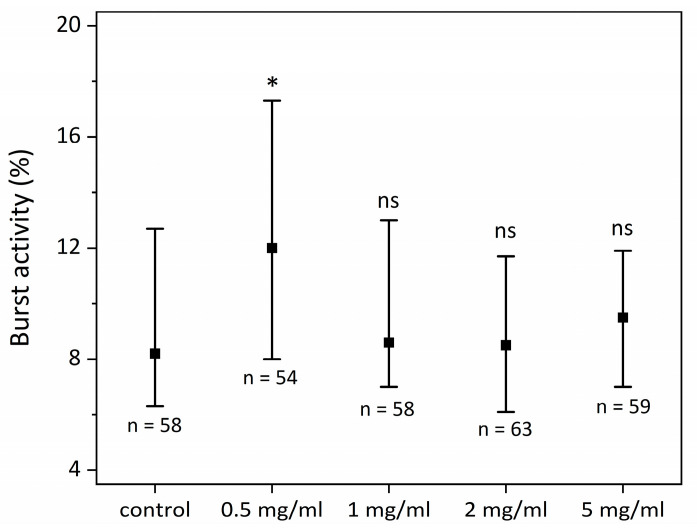
Figure Caption
Figure 1
Comparison of zebrafish larva motility after SCI exposure, * p < 0.01 compared to the control group, ns—not significant.
Figure Data
Acknowledgments
This image is the copyrighted work of the attributed author or publisher, and
ZFIN has permission only to display this image to its users.
Additional permissions should be obtained from the applicable author or publisher of the image.
Full text @ Int. J. Mol. Sci.