
Fig. 4
- ID
- ZDB-IMAGE-230501-33
- Publication
- Fontana et al., 2023 - Zebrafish ambra1b knockout reveals a novel role for Ambra1 in primordial germ cells survival, sex differentiation and reproduction
- All Figures
- Figures for Fontana et al., 2023
|
Fig. 4
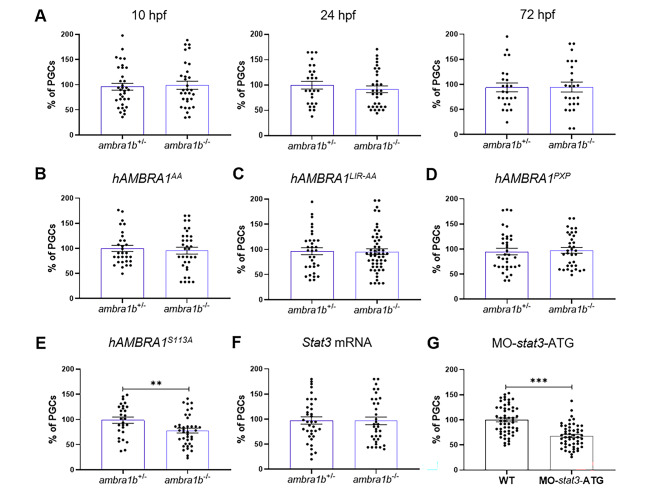
Injection of hAMBRA1 mRNA counteracts the loss of PGCs. (A) Quantification of PGCs at 10, 24 and 72 hpf after co-injection of one-cell embryos with GFP-nos1-3’UTR and hAMBRA1 mRNA (10 hpf: ambra1b+/− n = 34, ambra1b−/− n = 31; 24 hpf: ambra1b+/− n = 26, ambra1b−/− n = 32; 72 hpf: ambra1b+/− n = 24, ambra1b−/− n = 25). (B-E) Quantification of PGCs after injection with GFP-nos1-3’UTR mRNA and hAMBRA1 mRNA mutated in TRAF6 (hAMBRA1AA, B), LC3 (hAMBRA1LIR − AA, C), PP2A (hAMBRA1PXP, D) and CUL4–DDB1 (hAMBRA1S113A, E) binding sites (B: ambra1b+/− n = 30, ambra1b−/− n = 34; C: ambra1b+/− n = 33, ambra1b−/− n = 54; D: ambra1b+/− n = 36, ambra1b−/− n = 35; E: ambra1b+/− n = 28, ambra1b−/− n = 39). (F) Injection of one-cell stage ambra1b+/− and ambra1b−/− embryos with murine Stat3 mRNA and quantification of PGCs at 10-hpf (ambra1b+/− n = 29, ambra1b−/− n = 27). (G) Injection of one-cell stage WT embryos with MO-stat3-ATG and quantification of PGCs at 10-hpf (ambra1b+/− n = 55, ambra1b−/− n = 52). In all panels, the PGC number is expressed as percentage with respect to ambra1b+/− animals, in which the PGC number was settled as 100%. The histograms show data pooled together from four (A, F) or three (B, C, D, E, G) independent experiments. Error bars indicate SEM. Statistical analysis was performed using Student’s t-test. ** P < 0.01, *** P < 0.001