
Image
|
Figure Caption
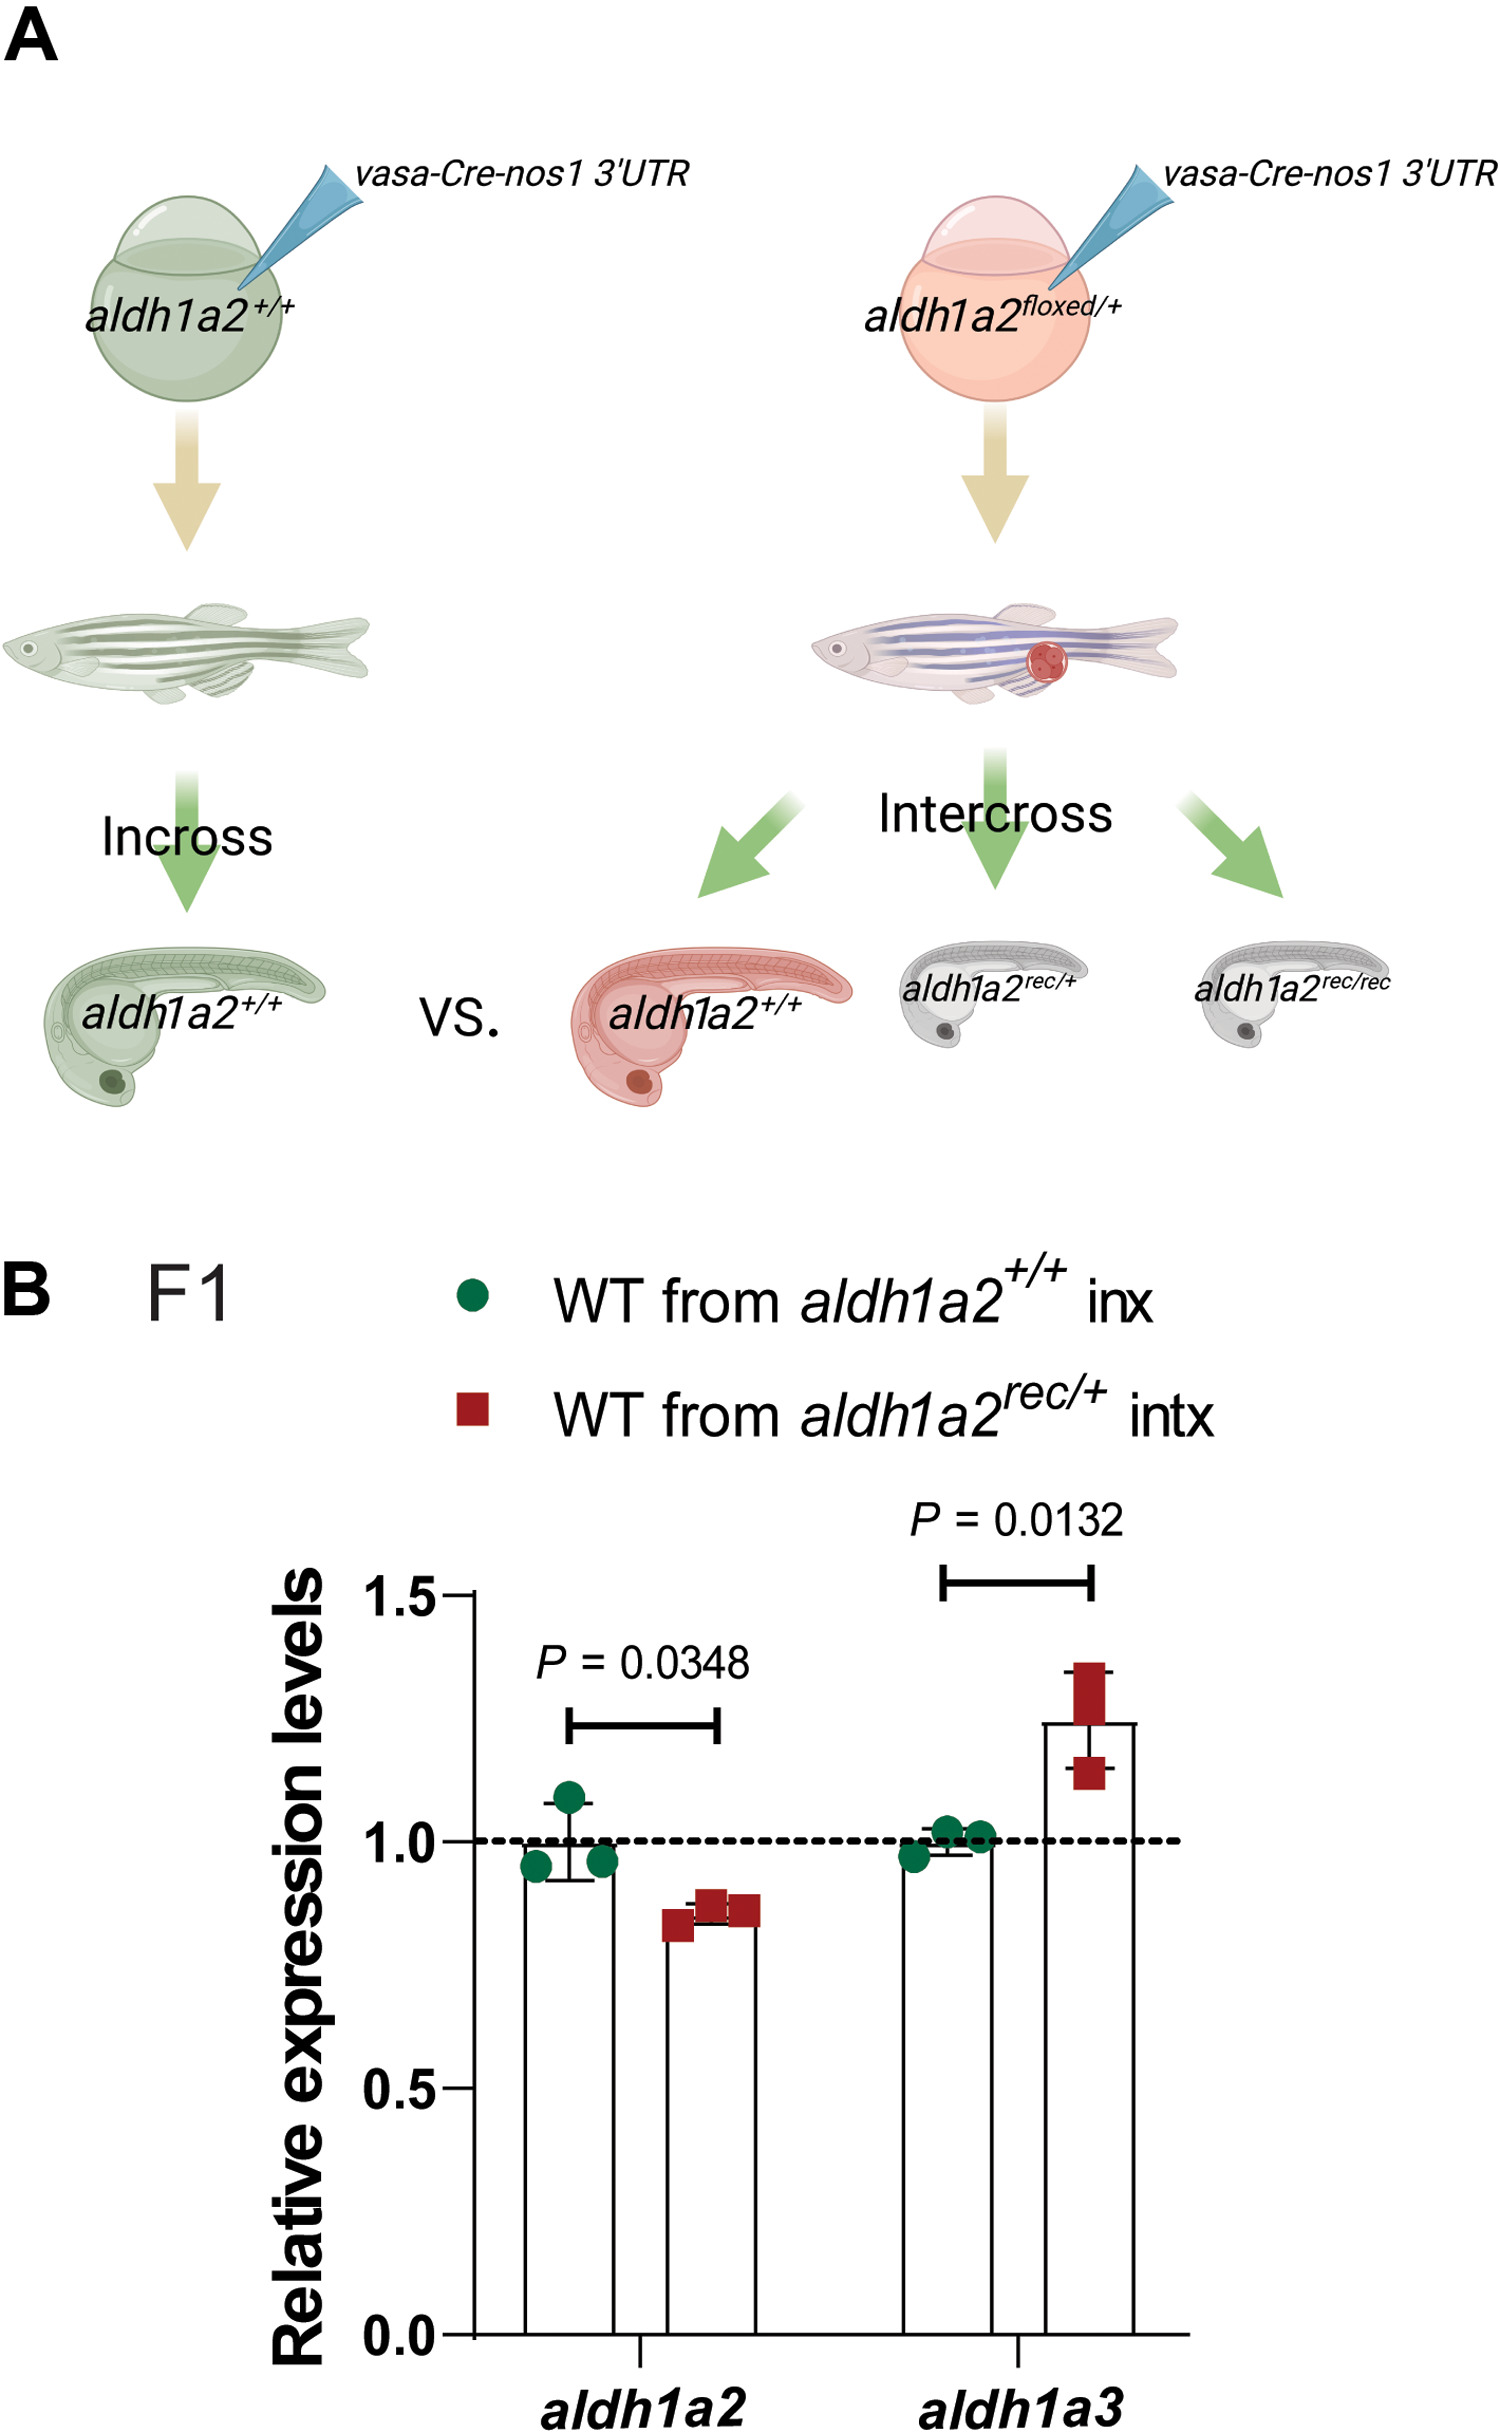
Fig. 3 (A) Schematic representation of experimental setup and genetic crosses used to obtain wild-type offspring; red cell indicates a germline-specific mutation. (B) Relative mRNA levels of aldh1a2 and aldh1a3 in 24 hpf wild-type embryos from aldh1a2+/+ incrosses (inx) and aldh1a2rec/+ intercrosses (intx). Control expression levels were set at 1. n = 3 biologically independent samples. Data are means ± SD, and a two-tailed Student’s t test was used to calculate P values. Ct values are listed in table S1. (A) was created with BioRender.com.
Acknowledgments
This image is the copyrighted work of the attributed author or publisher, and
ZFIN has permission only to display this image to its users.
Additional permissions should be obtained from the applicable author or publisher of the image.
Full text @ Sci Adv