
Fig. 5
- ID
- ZDB-IMAGE-230430-81
- Publication
- Saraswathy et al., 2022 - Myostatin is a negative regulator of adult neurogenesis after spinal cord injury in zebrafish
- All Figures
- Figures for Saraswathy et al., 2022
|
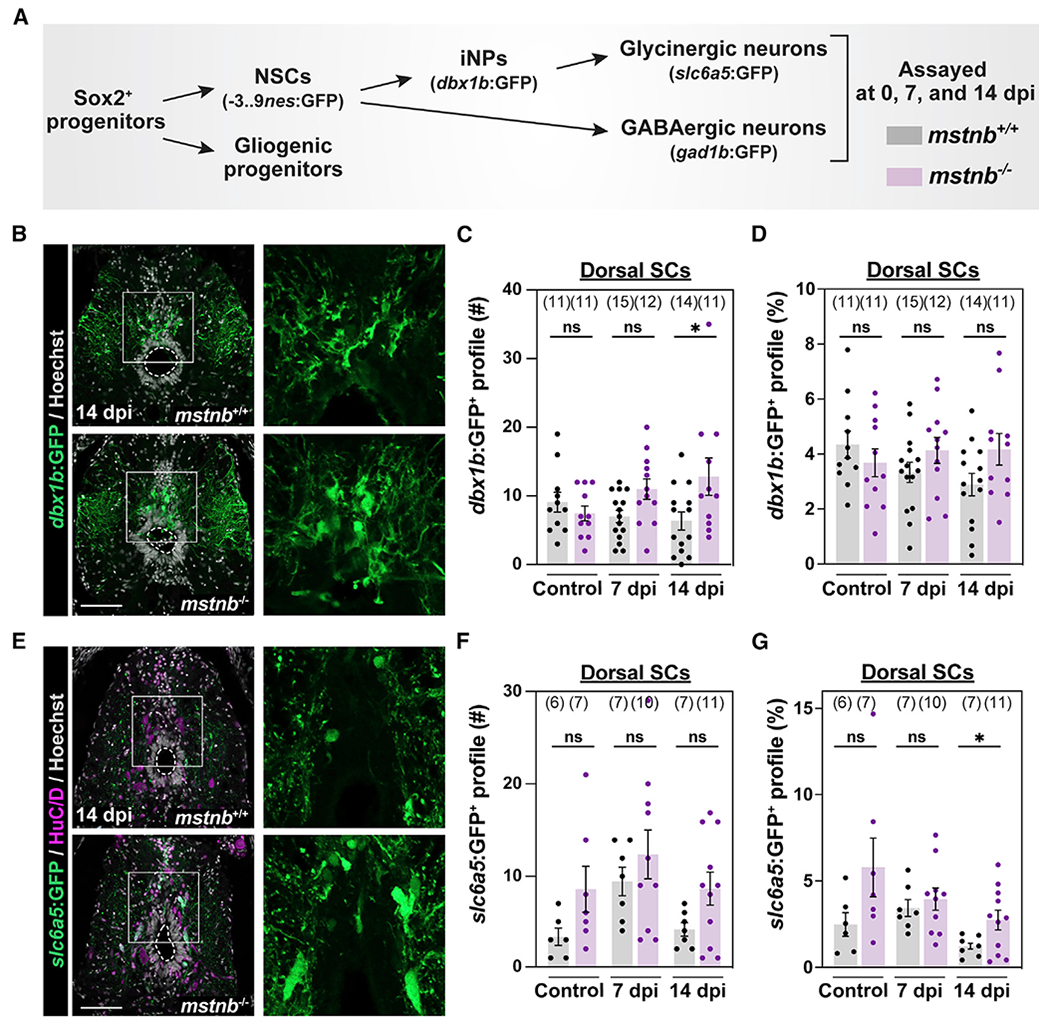
Fig. 5
(A) Experimental timeline to elucidate different steps of adult neurogenesis.
(B) GFP staining in dbx1b:GFP;mstnb−/− SC sections at 14 dpi. dbx1b:GFP;mstnb+/+ siblings were used as controls. Dotted ovals delineate central canal edges. Regions in the rectangular boxes are shown at high magnification.
(C and D) The numbers of dbx1b+ iNPs (#) were quantified in D SC sections 450 μm rostral to the lesion (C). The proportions of dbx1b+ iNPs (%) represent the numbers of dbx1b+ iNPs normalized to the total numbers of nuclei for each section (D).
(E) GFP staining in s/c6a5:GFP:GFP;mstnb−/− SC sections at 14 dpi. slc6a5:GFP:GFP;mstnb+/+ siblings were used as controls. Dotted ovals delineate central canal edges. Regions in the rectangular boxes are shown at higher magnification.
(F and G) The numbers of glycinergic s/c6a5:GFP+ neurons (#) were quantified in D SC sections 450 μm rostral to the lesion (F). The proportions of slc6a5:GFP+ neurons (%) represent the numbers of slc6a5:GFP+ neurons normalized to the total numbers of nuclei for each section (G).
Dots represent individual animals from 2 independent clutches. For all quantifications, cross-SC sections 450 μm rostral to the lesion site were quantified. Error bars depict SEM, and statistical significance was determined by one-way ANOVA. Multiple-comparisons p values are shown. *p < 0.05; ns, p > 0.05. Scale bars, 50 μm.