
Fig. 4
- ID
- ZDB-IMAGE-230430-80
- Publication
- Saraswathy et al., 2022 - Myostatin is a negative regulator of adult neurogenesis after spinal cord injury in zebrafish
- All Figures
- Figures for Saraswathy et al., 2022
|
Fig. 4
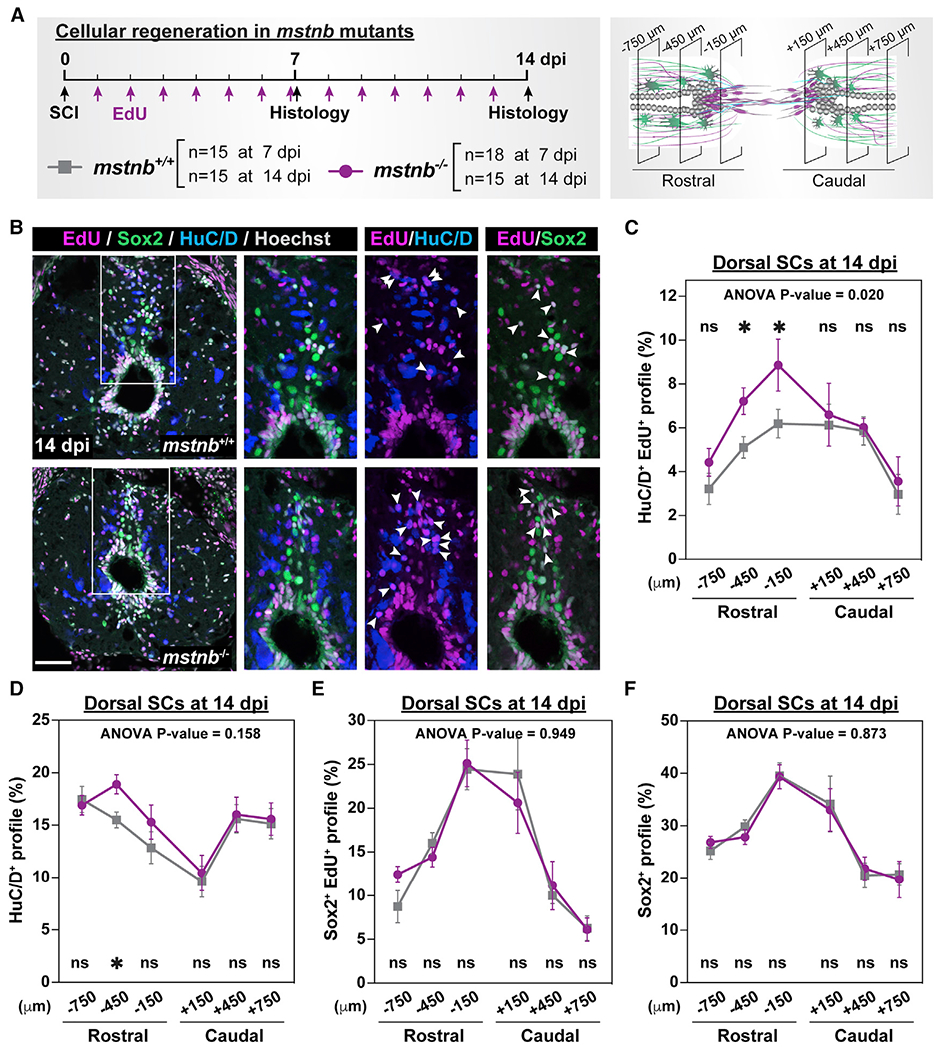
(A) Experimental timeline to assess the rates of neuronal differentiation and progenitor self-renewal. Animal numbers are indicated for each genotype, and two independent replicates are shown.
(B) Immunohistochemistry for EdU (magenta), Sox2 (green), and HuC/D (blue) in SC sections of mstnb+/+ and mstnb−/− at 14 dpi. Regions in the rectangular boxes are shown at high magnification. Arrowheads indicate HuC/D>+ EdU>+ neurons or Sox2+ EdU>+ progenitors.
(C) Regenerated HuC/D>+ EdU>+ neurons were quantified in D SC sections at 14 dpi. The proportions of HuC/D>+ EdU>+ neurons (%) representthe numbers of HuC/D+ EdU+ neurons normalized to the total numbers of nuclei for each section.
(D) HuC/D>+ neurons were quantified in D SC sections at 14 dpi. The proportions of HuC/D>+ neurons (%) represent the numbers of HuC/D>+ neurons normalized to the total numbers of nuclei for each section.
(E) Sox2+ EdU>+ progenitors were quantified in D SC sections at 14 dpi. The proportions of Sox2+ EdU>+ progenitors (%) represent the numbers of Sox2+ EdU>+ progenitors normalized to the total numbers of nuclei for each section.
(F) Sox2+ progenitors were quantified in D SC sections at 14 dpi. The proportions of Sox2+ progenitors represent the numbers of Sox2+ progenitors normalized to the total numbers of nuclei for each section.
Error bars depict SEM, and statistical significance was determined by two-way ANOVA. ANOVA p values and multiple-comparisons p values are indicated. *p < 0.05; ns, p > 0.05. Scale bars, 50 μm.