
Figure 5
- ID
- ZDB-IMAGE-230430-70
- Genes
- Publication
- Mignani et al., 2023 - Deficiency of AP1 Complex Ap1g1 in Zebrafish Model Led to Perturbation of Neurodevelopment, Female and Male Fertility; New Insight to Understand Adaptinopathies
- All Figures
- Figures for Mignani et al., 2023
|
Figure 5
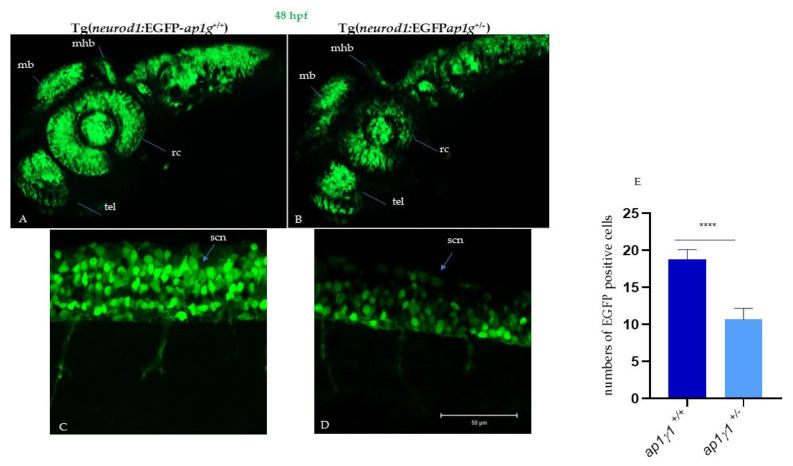
Neuronal characterization of ap1g1+/+ and ap1g1+/− embryos: Confocal images of ap1g1+/+ and ap1g1+/− embryos in transgenic background tg(neurod1:EGFP) 48 hpf. Lateral view of the central nervous system (A) and of spinal cord neurons (B) acquired using an LSM510 Meta confocal microscope (Zeiss (Oberkochen, Germany). (A,B) Images were acquired using a Plan-Neofluar 10X/0.3NA objective. A Z-stack was performed to acquire the whole central nervous system and Maximum Intensity Projection was obtained using Zen Black software. Abbreviations: mb, midbrain; hb, hindbrain; mhb, midbrain–hindbrain boundary; tel, telencephalon; rc, retinal cells; snc, spinal cord neurons. Single plane images were acquired using a PlanApochromat-63X/1.4 NA oil DIC objective. Size bar: 50 µm. (C,D) EGFP-positive cells were quantified by drawing polygonal regions on the image acquired and manually counting the number of cell somas in the selected area. The analysis is the result of 3 different experiments with n = 15 for each genotype. (E) Quantification of EGFP positive cells in the described spinal cord area described in figure C and D; **** p < 0.0001, Student’s t-test.