
Figure 4
- ID
- ZDB-IMAGE-230430-69
- Publication
- Mignani et al., 2023 - Deficiency of AP1 Complex Ap1g1 in Zebrafish Model Led to Perturbation of Neurodevelopment, Female and Male Fertility; New Insight to Understand Adaptinopathies
- All Figures
- Figures for Mignani et al., 2023
|
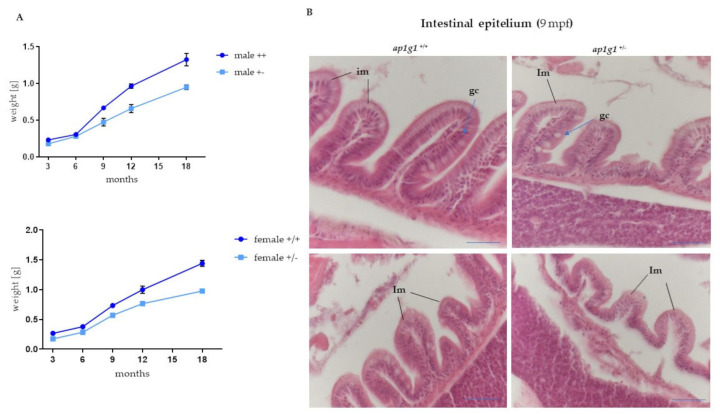
Figure 4
Histological analysis of intestinal epithelium in adult fish. (A) Growth curve of ap1g1+/+ and ap1g1+/−. Body weight (in gr) was measured at different ages of adult life from 3 to 18 months. Both males’ and females’ ap1g1+/− body weight is significantly lower compared to ap1g1+/+. Statistical significance was determined by multiple t-test comparing each age group. For each group, 10 individuals were used and data was derived from two different experimental groups. (B) Histological analysis of ap1g1+/+ and ap1g1+/− intestinal mucosa with abnormal epithelium at the villous tips and reduced height of villi in the heterozygous mutant at 9 months age-old compared to wild-type homozygous fish. Scale bar = 100 μm Abbreviations: im: intestinal mucosa; gc: globet cells.