
|
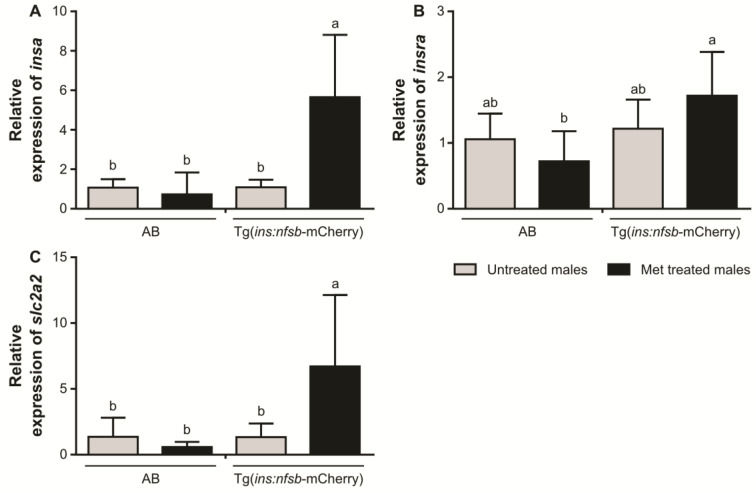
Figure 2
Gene expression of insulin metabolism markers in zebrafish sperm pools: (A) expression of insa in spermatozoa pools from AB males in control (n = 4) and metronidazole (Met) treatment (n = 4) groups and Tg(ins:nfsb-mCherry) in control (n = 5) and Met treatment (n = 7) groups; (B) expression of insra in spermatozoa pools from AB males in control (n = 4) and Met treatment (n = 4) groups and Tg(ins:nfsb-mCherry) in control (n = 7) and Met treatment (n = 7) groups; (C) expression of slc2a2 in spermatozoa pools from AB males in control (n = 4) and Met treatment (n = 4) groups and Tg(ins:nfsb-mCherry) in control (n = 5) and Met treatment (n = 6) groups. The plotted values represent means ± SD. Different letters represent statistical differences (one-way ANOVA, post hoc SNK, p < 0.05).