Figure 3
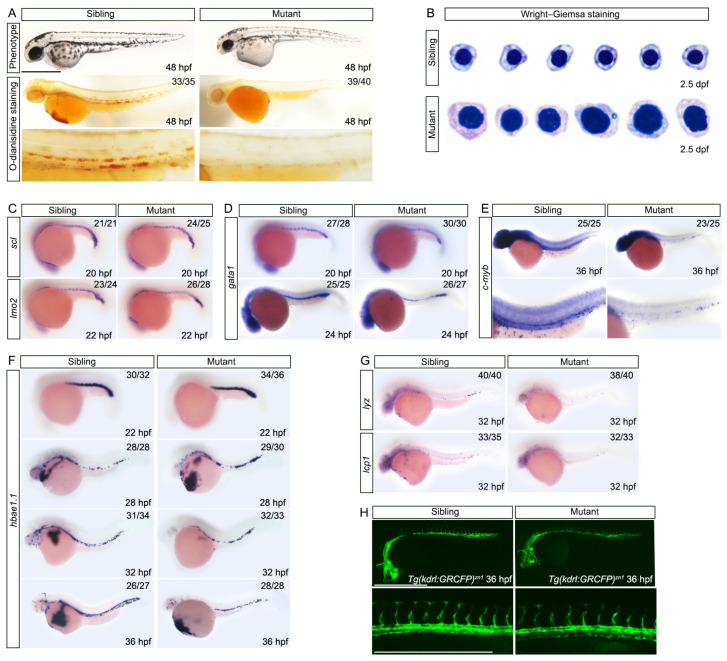
Nop56 deficiency impairs erythroid maturation. (A) o-Dianisidine staining showed depletion of erythroid cells in nop56−/− embryos compared to wildtype siblings at 48 hpf. (B) Wright–Giemsa staining of erythroid cells at 2.5 dpf in siblings and mutants. (C) WISH showed that the expression patterns of scl and lmo2 were indistinguishable between siblings and mutants before 24 hpf. (D) WISH showed no difference in gata1 expression in nop56−/− embryos at 20 hpf between siblings and mutants, but a minor reduction occurred at 24 hpf in mutants. (E) WISH revealed that c-myb expression was significantly reduced from 36 hpf. (F) Expression of hbae1.1 was gradually decreased from 32 to 36 hpf (n = 3). (G) WISH showed that the number of myeloid cells marked with lyz and lcp1 was slightly decreased at 32 hpf. (H) Analysis of vasculature after crossing nop56 mutants with the Tg(kdrl:GRCFP)zn1 transgenic fish line. The vasculature development was normal in mutants. All scale bars represent 500 μm.

