
Image
|
Figure Caption
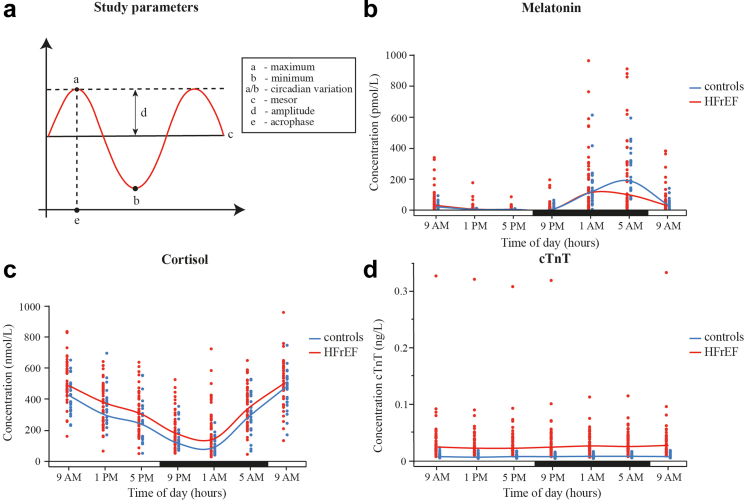
Fig. 1
24-hour hormonal output is intact in HFrEF patients. (a) Parameters used for quantitative analysis of the 24-h melatonin and cortisol variation. 24-hour (b) melatonin (pmol/L), (c) cortisol (nmol/L) and (d) cTnT (ng/L) concentration. Each dot (red = patients, blue = controls) represents individual concentration at a given time-point. Lines indicate median values of all patients (red; N = 44–46) and controls (blue; N = 23–24). Horizontal bar indicates day (=white) and night (=black). cTnT = cardiac troponin T; HFrEF = heart failure with reduced ejection fraction.
Acknowledgments
This image is the copyrighted work of the attributed author or publisher, and
ZFIN has permission only to display this image to its users.
Additional permissions should be obtained from the applicable author or publisher of the image.
Full text @ EBioMedicine