Fig. 9
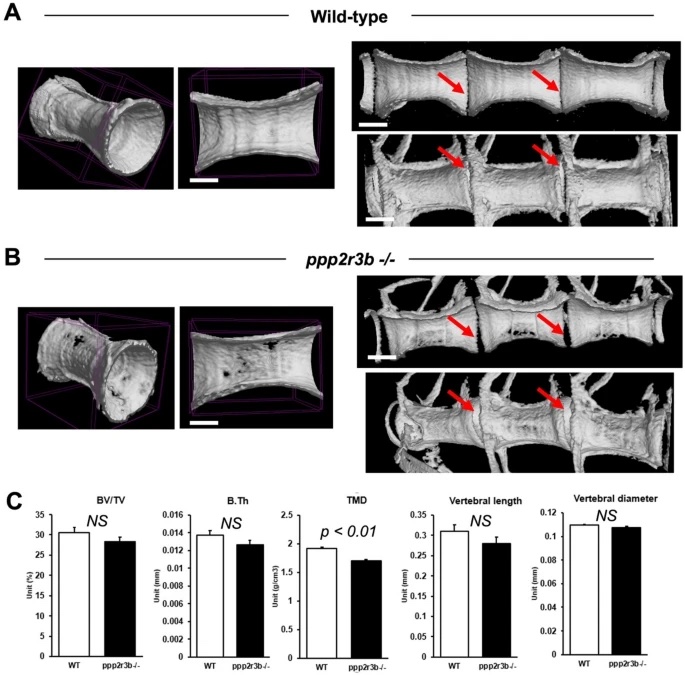
Reduced mineral density of vertebral cortical bone in ppp2r3b−/− mutants. (A, B) Representative 3D and cross-sectional images from microCT scans of vertebrae in wild-type and ppp2r3b−/− mutant zebrafish at 36 dpf. Note holes are apparent in the mutant vertebrae. Red arrows indicate intervertebral discs. (C) Quantification of a selection of cortical bone parameters measured in wild-type and ppp2r3b−/− mutant vertebrae (n = 3). BV/TV, bone volume/tissue volume; B.Th, bone thickness; TMD, tissue mineral density. p-values are given (t-test). NS, not significant. Average tail length (TL) for both mutant and wild-type animals was 12.6 mm with no difference between the two groups (p-value = 0.15, t-test). TLs of the two representative animals shown in (A) and (B) were 12.912 and 12.907 mm, respectively. Animals are generation F4. Scale bars are 5 mm in (A, B) left panel; 3.75 mm (A, B) right panels.

