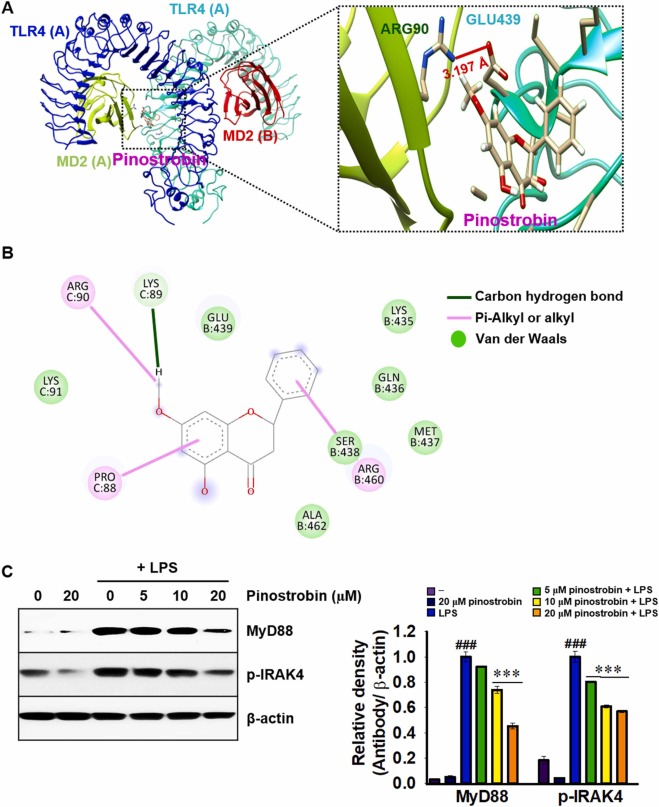
Fig. 5 Pinostrobin possibly binds to the TLR4/MD2 complex. (A) The ribbon model (pose 1, the strongest binding pose) represents that pinostrobin fits into the TLR4/MD2 complex (PDB; 3FXI, left). MD2 (red and chartreuse) and TLR4 (cyan and blue) are shown. Block dotted square shows the binding site and enlarged (right). (B) 2D interaction diagram from pose 1 was obtained using BIOVIA Discovery Studio Visualizer. Green line, carbon hydrogen bond; pink line, π-alkyl or alkyl interactions; light green circle, van der Waals interactions. (C) RAW 264.7 macrophages were pretreated with pinostrobin (0–20 μM) 2 h before incubation with 300 ng/mL LPS. Cellular protein was extracted 30 min after LPS treatment, and western blotting was performed. β-Actin was used for normalizing MyD88 and p-IRAK4 expression. The relative density was calculated using ImageJ software. ###, p < 0.001 vs. untreated cells; ***, p < 0.001 vs. LPS-treated cells.
Image
Figure Caption
Acknowledgments
This image is the copyrighted work of the attributed author or publisher, and
ZFIN has permission only to display this image to its users.
Additional permissions should be obtained from the applicable author or publisher of the image.
Full text @ Biomed. Pharmacother.

