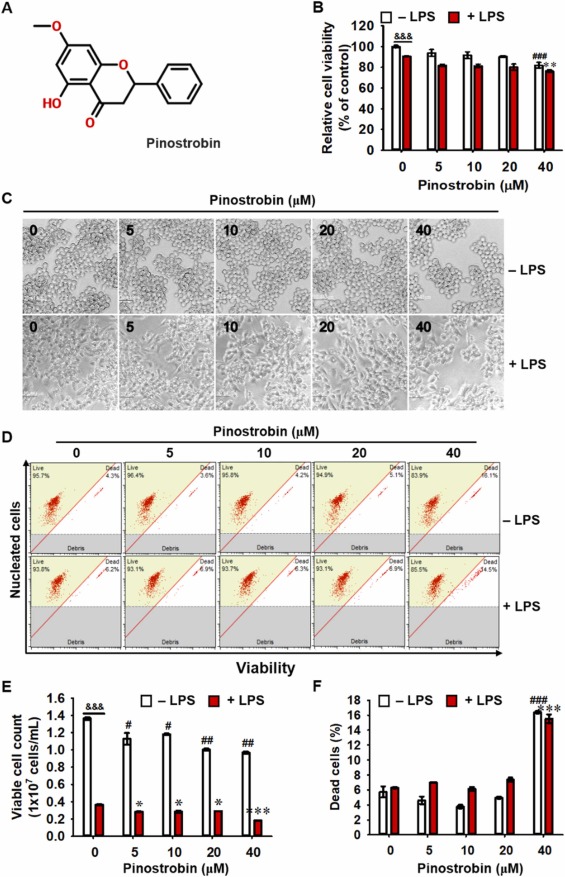
Fig. 1 Pinostrobin at concentrations of less than 20 μM does not show cytotoxicity. (A) Chemical structure of pinostrobin. (B-F) RAW 264.7 macrophages were treated with 0–40 µM pinostrobin for 2 h, followed by stimulation with 300 ng/mL LPS for 24 h. (B) Cell viability was determined by MTT assay. (B) Morphological images were captured under phase-contrast microscopy. (C) Cell viability was measured using flow cytometry. (D) Viable cell count and (E) dead cell population were obtained from flow cytometric analysis. &&&, p < 0.001 vs. untreated cells (Student's t-test); #, p < 0.05, ##, p < 0.01, and ###, p < 0.001 vs. untreated cells (One-way ANOVA); *, p < 0.05, **, p < 0.01, and ***, p < 0.001 vs. LPS-treated cells (One-way ANOVA).
Image
Figure Caption
Acknowledgments
This image is the copyrighted work of the attributed author or publisher, and
ZFIN has permission only to display this image to its users.
Additional permissions should be obtained from the applicable author or publisher of the image.
Full text @ Biomed. Pharmacother.

