
|
Figure 2
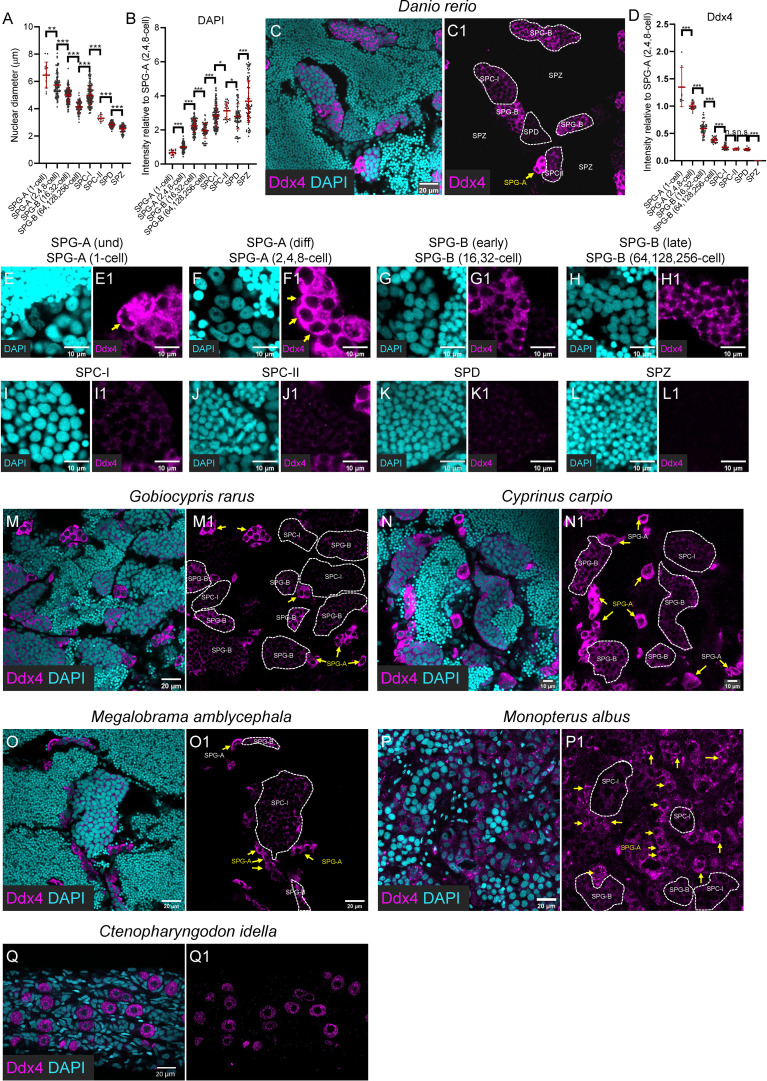
Progressively decreased expression of Ddx4 along spermatogenesis. (A) The graph showing the nuclear diameter of different types of spermatogenic cells. (B) The graph showing the DAPI intensity of different types of spermatogenic cells relative to that of the SPG-A(2,4,8-cell). (C, C1) Representative images of a zebrafish testis section showing the expression of Ddx4 (magenta) co-stained with DAPI (cyan). (D) The graph showing the Ddx4 intensity of different types of spermatogenic cells relative to that of the SPG-A(2,4,8-cell). (E-L, E1-L1) The Representative images showing the SPG-A(1-cell) (E, E1), the SPG-A(2,4,8-cell) (F, F1), the SPG-B(16,32-cell) (G, G1), the SPG-B(64,128,256-cell) (H, H1), the SPC-I (I, I1), the SPC-II (J, J1), the SPD (K, K1) and the SPZ (L, L1). (M-P, M1, P1) The representative images showing the expression of Ddx4 in Gobiocypris rarus (M, M1), Cyprinus carpio (N, N1), Megalobrama amblycephala (O, O1), Monopterus albus (P, P1) and Ctenopharyngodon idella (Q, Q1). SPG-As are indicated by the arrows, and other types of spermatogenic cells are circled by dashed lines. All data were collected from three independent testicular samples. All values are the mean ± STD. Unpaired and two-tailed Student’s t-test were used to compare means. *P<0.05; **P<0.01; ***P<0.001, n.s. not significant.