
FIGURE 6
- ID
- ZDB-IMAGE-230420-78
- Publication
- Santos-Ledo et al., 2022 - Oligodendrocyte origin and development in the zebrafish visual system
- All Figures
- Figures for Santos-Ledo et al., 2022
|
FIGURE 6
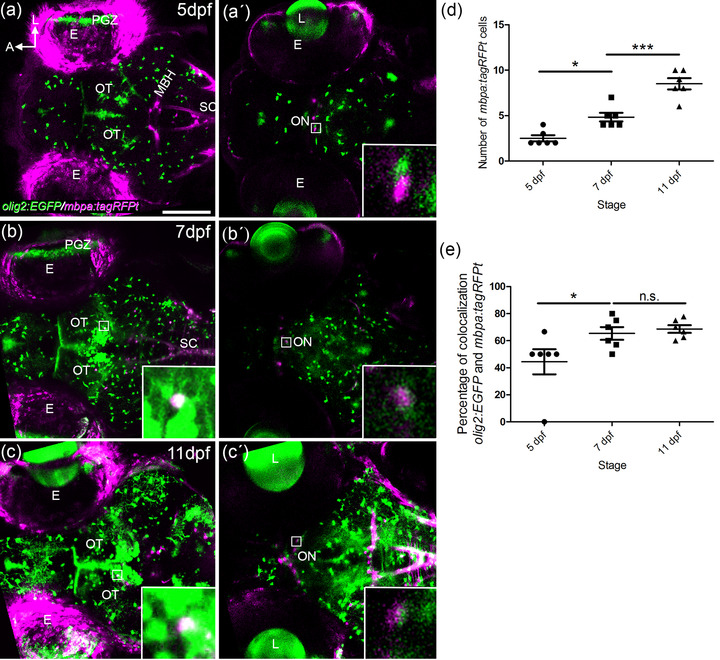
Myelination of the visual system. Confocal images of whole mount olig2:EGFP/mbpa:tagRFPt embryos at 5 (a, a′), 7 (b, b′), and 11 (c′) dpf. A 25 μm thick stack is shown as max intensity projection in the OT area (a, b, and c) and the optic nerve chiasm (a′, b′, and c′). Detection of mbpa:tagRFPt starts at 5 dpf in the ON (a′). The number of mbpa:tagRFPt cells increase significantly from 3–4 cells at 5 dpf to 8–10 cells at 11 dpf (a′, b′, c′, quantified in d). A total of 40% olig2:EGFP colocalize with mbpa:tagRFPt at 5 dpf. This percentage increases to 60% from 5 dpf to 7 dpf (quantified in e). E: eye: L: lens; MBH; midbrain hindbrain boundary; ON: optic nerve; OT: optic tectum; PGZ: proliferative germinal zone; SC: spinal cord. Scale bar: 100 μm