
|
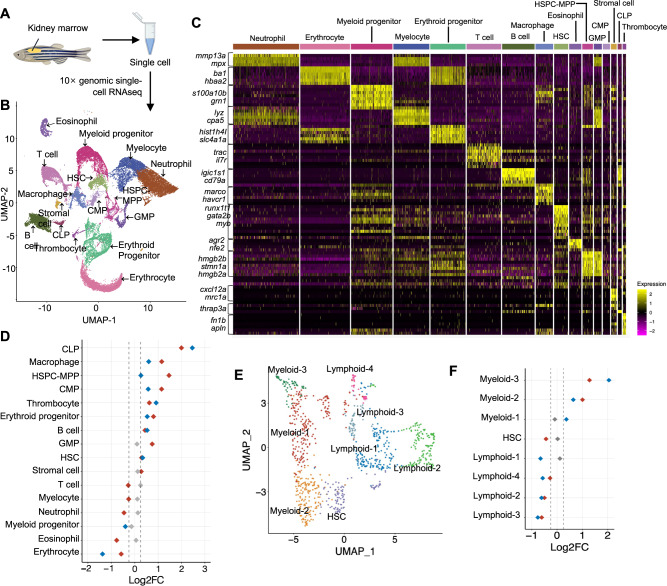
Fig. 4
A Schematic representation of the single-cell RNA sequencing experimental workflow. B 16 distinct cell clusters were visualized by Uniform manifold approximation projection (UMAP). C Cell type classification based on the key hematopoietic markers identified in zebrafish. D Quantitation of proportions of distribution between double mutant and WT KM cells in different clusters. E Sub-clustering of HSPC-MPP population. F Quantitation of proportions of distribution between double mutant and WT zebrafish in the different sub-clusters of HSPC-MPP. The red dot represents the difference of the Log2FC of the proportion of a specific cluster in Tg(Runx1:FLT3ITDIDH2R140Q) compared to that of WT is over 0.25 or less than −0.25, the blue dot represents the difference of the Log2FC of the proportion of a specific cluster in Tg(Runx1:FLT3ITDIDH2R172K) compared to that of WT is over 0.25 or less than −0.25, and the gray dot indicates no change (−0.25 < log2FC < 0.25) was found in the proportion of a specific cluster when compared between the double mutant and WT zebrafish.