
IMAGE
Fig 4
- ID
- ZDB-IMAGE-230420-35
- Publication
- Eeza et al., 2023 - Probing microstructural changes in muscles of leptin-deficient zebrafish by non-invasive ex-vivo magnetic resonance microimaging
- All Figures
- Figures for Eeza et al., 2023
Image
|
Figure Caption
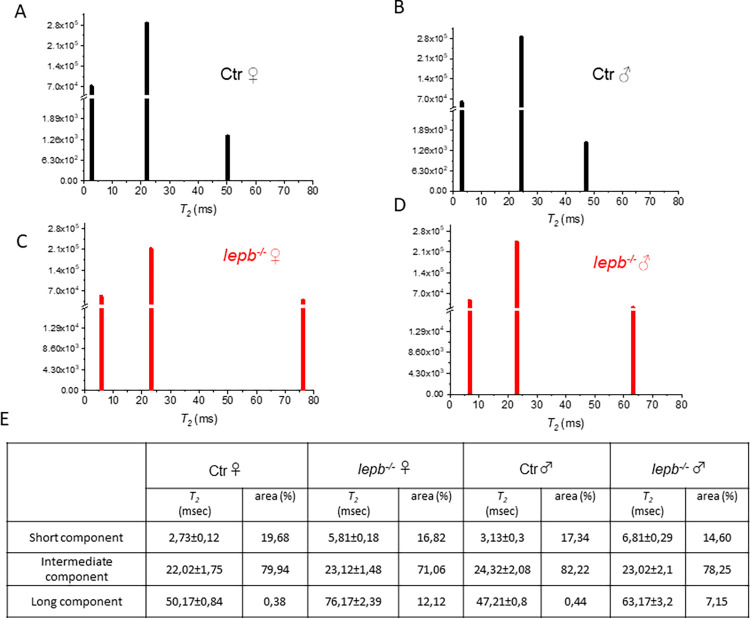
Fig 4
Multicomponent analysis of the experimental T2 relaxation decay curves using a non-negative least square based algorithm (NNLS).
NNLS least-squares spectra of (A) Ctr ♀ (B) Ctr ♂ (C) lepb-/- ♀ and (D) lepb-/- ♂ zebrafish in ROIs located in the fat infiltered muscle area. (E) Time and amplitude of various T2 components (short, intermediate, and long) in msec ± SD and the percentage of areas for each component.
Acknowledgments
This image is the copyrighted work of the attributed author or publisher, and
ZFIN has permission only to display this image to its users.
Additional permissions should be obtained from the applicable author or publisher of the image.
Full text @ PLoS One