
Fig 1
- ID
- ZDB-IMAGE-230420-32
- Publication
- Eeza et al., 2023 - Probing microstructural changes in muscles of leptin-deficient zebrafish by non-invasive ex-vivo magnetic resonance microimaging
- All Figures
- Figures for Eeza et al., 2023
|
Fig 1
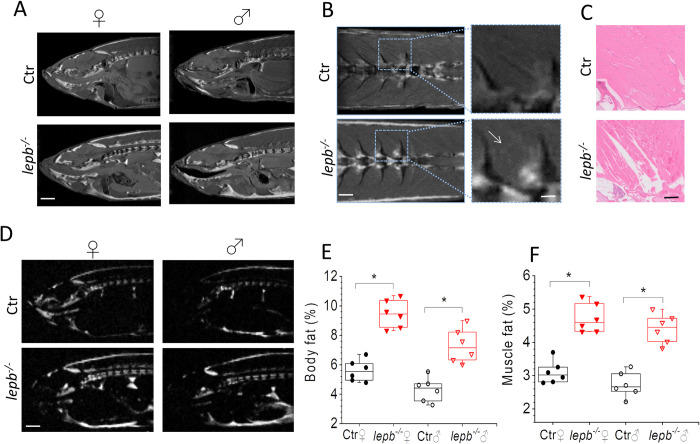
(A) Representative sagittal MR images of female (♀) and male (♂) Ctr and lepb-/- zebrafish measured by RARE pulse sequence (TE = 15 ms with effective TE of 33.6 ms; TR = 2000 ms; ns = 8; Scan time 17 min). Scale bar: 1 mm. (B) Representative coronal MR images showing muscle area of female Ctr and lepb-/- zebrafish measured by RARE pulse sequence. Scale bar: 500 μm. A zoomed view (right column) showing fat infiltration in muscles of lepb-/- zebrafish. Scale bar: 250 μm; (C) Histological sections from the same muscle region as in (B) stained with HE staining. Scale bar: 250 μm. (D) Images of fat distribution in the sagittal plane, acquired with Chemical Shift Selective (CHESS) pulse sequence in female Ctr and lepb-/- zebrafish. Scale bar: 1 mm; (E) Quantification of body fat in control and lepb-/- female and male adult zebrafish measured from CHESS MR images (n = 6 per group) (***p < 0.001); (F) Quantification of fat in muscle region from control and lepb-/- female and male adult zebrafish measured from CHESS MR images (n = 6 per group) (***p < 0.001).