
Image
|
Figure Caption
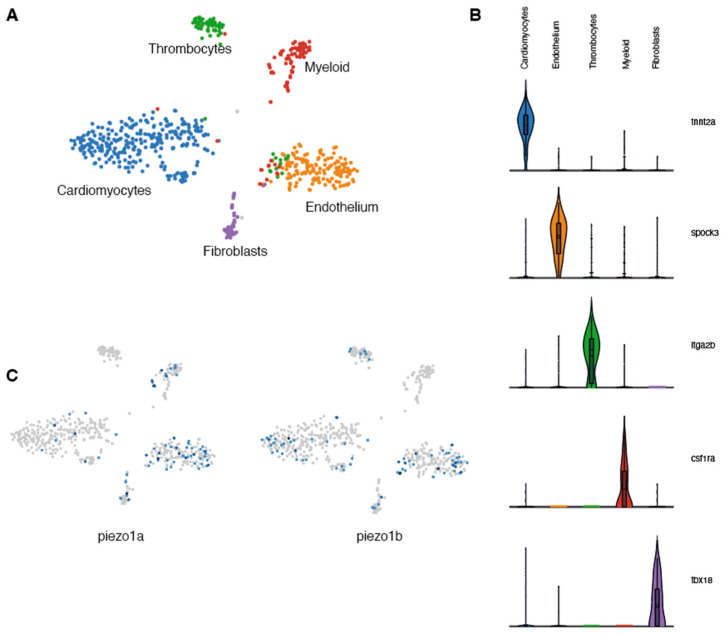
Figure 1
Single-nuclei RNAseq analysis of zebrafish Piezo expression in the heart. (A) UMAP clusters of the different populations of cells identified in zebrafish hearts. (B) Violin plots showing the 5 genes used to characterize the different cell populations. (C) UMAP plots indicating the cells expressing piezo1a or piezo1b.
Acknowledgments
This image is the copyrighted work of the attributed author or publisher, and
ZFIN has permission only to display this image to its users.
Additional permissions should be obtained from the applicable author or publisher of the image.
Full text @ Int. J. Mol. Sci.