
|
Figure 5
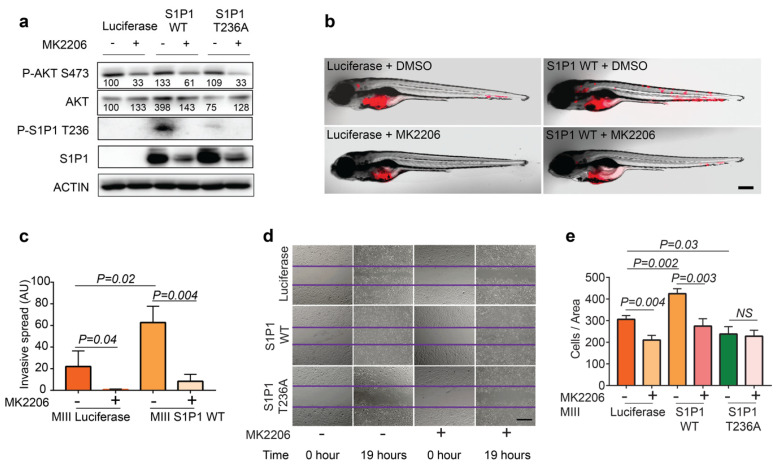
AKT-mediated phosphorylation of S1P1 T236 drives TNBC invasion. (a) Western blot analysis of P-AKT S473, AKT, P-S1P1 T236, and S1P1 expression in MIII cells overexpressing Luciferase, S1P1 WT, or S1P1 T236A in the presence or absence of 0.3 μM MK2206 treatment. P-AKT and AKT to ACTIN ratio are shown as relative values, with the vehicle-treated cells overexpressing Luciferase set as 100. (b,c) Wound-scratch assay (b) and data quantification (c) Reveal migration characteristics of MIII cells overexpressing Luciferase, S1P1 WT, or S1P1 T236A treated with DMSO or MK2206 (90 nM) at 0 and 19 h post scratching, showing that MK2206′s ability to inhibit migration of TNBC cells depends on AKT-mediated phosphorylation of S1P1 T236 (n = 3 per group). (d) Overlay of brightfield and red fluorescence images of zebrafish xenografts transplanted with RFP+ MIII cells overexpressing Luciferase or S1P1 WT treated with DMSO or MK2206 (0.3 μM) at 3 dpt. (e) Quantification of fluorescence intensity of invasive tumor cells outside the injection area (n = 3 per group). Scale bar = 200 µm in (b) and Scale bar = 5 µM in (d). Data are presented as Mean ± SEM.