
|
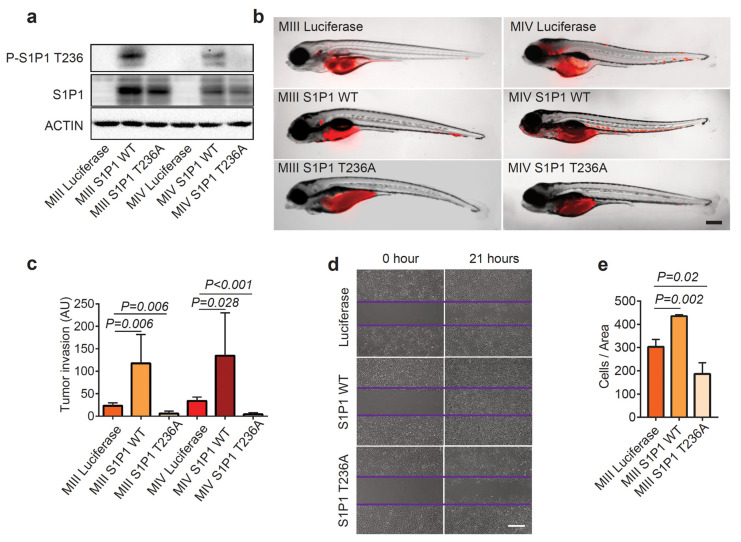
Figure 3
P-S1P1 T236 contributes to the distant spread of TNBC. (a) Western blotting analysis of P-S1P1 T236, S1P1, and ACTIN in MIII and MIV cells overexpressing Luciferase, S1P1 WT, or the phosphorylation-defective S1P1 T236A mutant. (b) Overlay of brightfield and red fluorescence images of zebrafish xenografts transplanted with RFP+ MIII and MIV cells overexpressing Luciferase, S1P1 WT, or S1P1 T236A at 3 dpt (right panel). (c) Quantification of invasive properties of MIII and MIV cells overexpressing Luciferase, S1P1 WT, or S1P1 T236A in zebrafish xenografts based on fluorescence intensity of RFP+ tumor cells outside of the initial injection area (n = 6 for MIII and MIV overexpressing Luciferase, and n = 3 for MIII and MIV overexpressing S1P1 WT or S1P1 T236A). (d,e) Wound-scratch assay (d) and quantification (e) show increased migration properties of MIII cells overexpressing S1P1 WT though not S1P1 T236A at 21 h after wound scratch, compared to control Luciferase-overexpressing cells (n = 3 per group). Data are presented as Mean ± SEM. Scale bar = 200 µm in (b) and Scale bar = 5 μM in (d).