
|
Figure 2
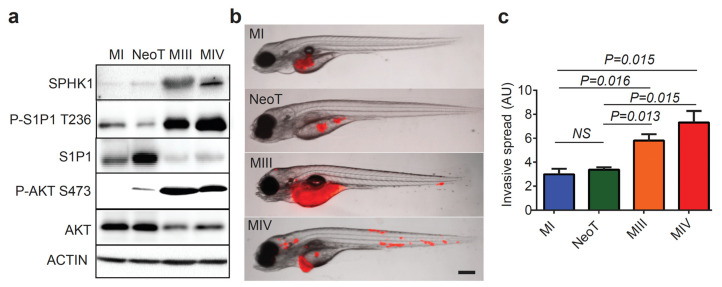
Increased Levels of P-S1P1 T236 are linked with TNBC Progression. (a) Western blot analysis of SPHK1, P-S1P1 T236, S1P1, phospho-AKT S473 (P-AKT S473), AKT, and ACTIN levels in human MI, NeoT, MIII, and MIV cells. (b) Overlay of brightfield and fluorescence images of zebrafish embryos transplanted with RFP+ human MI, NeoT, MIII, and MIV cells at 3 days post-transplantation (dpt; n = 3 per group). The scale bar represents 200 µm. (c) Quantification of invasive spread in zebrafish embryos based on fluorescence intensity of MI, NeoT, MIII, and MIV cells (n = 3 per group). Data presented as Mean ± SEM. NS, not significant.