
Image
|
Figure Caption
Figure 1
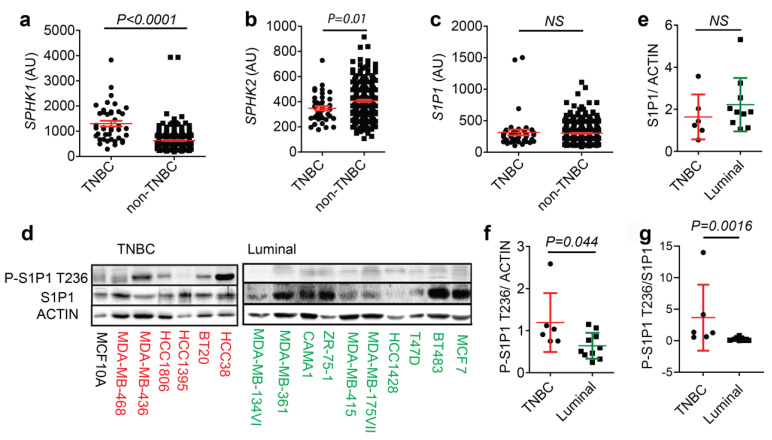
Phospho-S1P1 T236 Levels, but not Total S1P1, are Elevated in Human TNBC Cells. (a–c) Relative transcript levels of SPHK1 (a), SPHK2 (b), and S1P1 (c) in human TNBC (n = 41) and non-TNBC samples (n = 385) from a reanalyzed microarray dataset (GSE2034; [24]). (d) Western blot analysis of phospho-S1P1 T236 (P-S1P1 T236), total S1P1, and ACTIN levels in human TNBC (n = 6) and luminal (n = 10) cell lines with MCF10A nontransformed cell line as a control. (e–g) S1P1 (e) and P-S1P1 T236 (f) to ACTIN as well as P-S1P1 T236 to S1P1 ratio (g) in TNBC and luminal breast cancer cell lines. Data indicate mean ± SEM.
Acknowledgments
This image is the copyrighted work of the attributed author or publisher, and
ZFIN has permission only to display this image to its users.
Additional permissions should be obtained from the applicable author or publisher of the image.
Full text @ Cells