
Image
|
Figure Caption
Figure 4
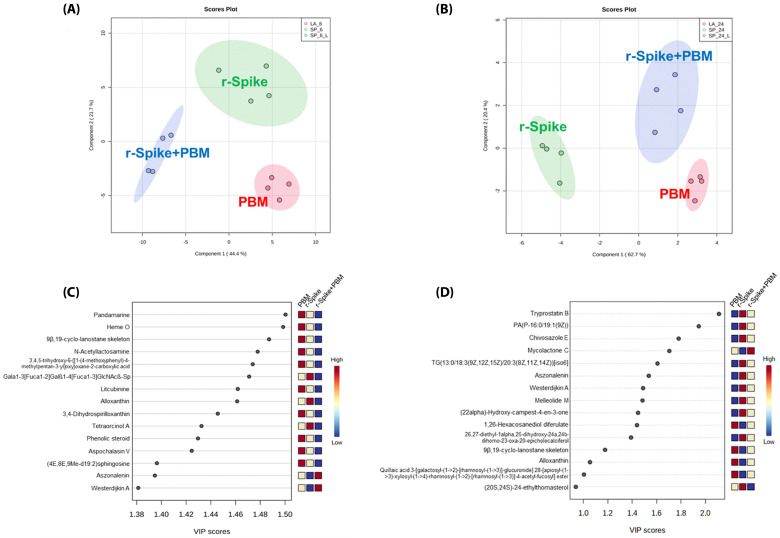
Supervised data analysis from metabolomics data to differentiate the PBM, rSpike, and (rSpike + laser) groups. (A) PLS-DA of the 6 h groups; (B) PLS-DA of the 24 h groups; (C) Variable importance for the projection (VIP) graph for the 6 h groups’ comparison; (D) VIP graph for the 24 h groups’ comparison.
Acknowledgments
This image is the copyrighted work of the attributed author or publisher, and
ZFIN has permission only to display this image to its users.
Additional permissions should be obtained from the applicable author or publisher of the image.
Full text @ Int. J. Mol. Sci.