
|
Figure 1
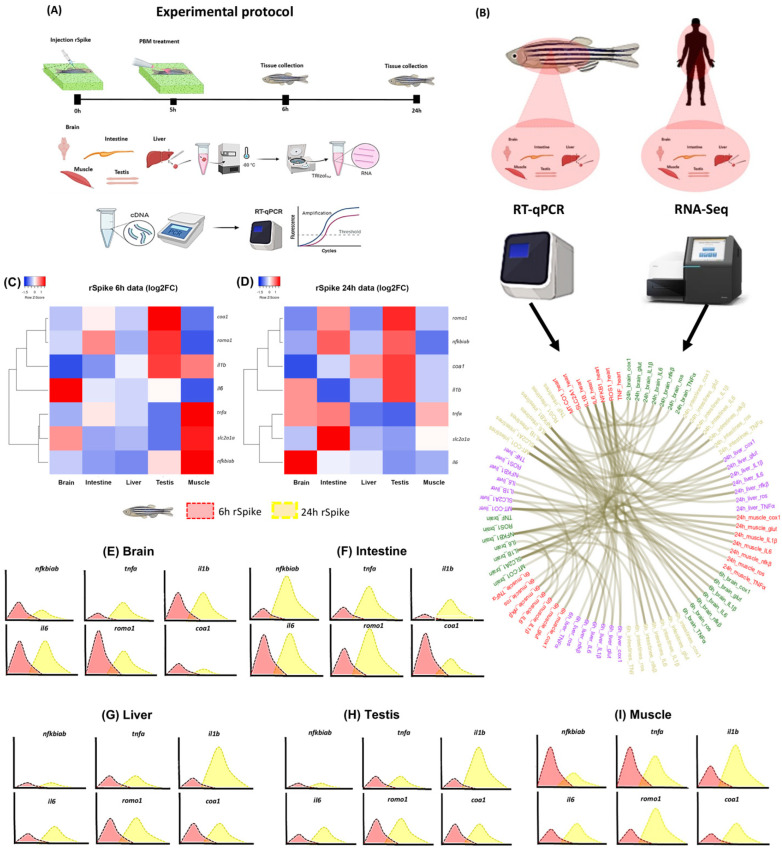
Overview of the transcriptional signature of COVID-19-associated cytokine storm syndrome in a zebrafish model. (A) Experimental protocol; (B) Chord diagram of the transcriptional signature and evolution of fold-change in the rSpike group in different tissue with the comparison of RNA-seq expression analysis in human tissue with COVID-19 (n = 30) versus without COVID-19 (n = 36) (from data set); (C) Heatmap illustrating the fold-change of relative expression levels of related genes in the brain, intestine, liver, testis, and muscle treated with rSpike at 6 h; (D) Heatmap illustrating the fold-change of relative expression levels of related genes in the brain, intestine, liver, testis, and muscle treated with rSpike at 24 h; Curve chart illustrating the relative expression levels of genes in (E) the brain, (F) intestine, (G) liver, (H) testis, and (I) muscle. The x-axis represents the different times (red 6 h and yellow 24 h), and the y-axis represents each gene’s relative expression.