
Image
|
Figure Caption
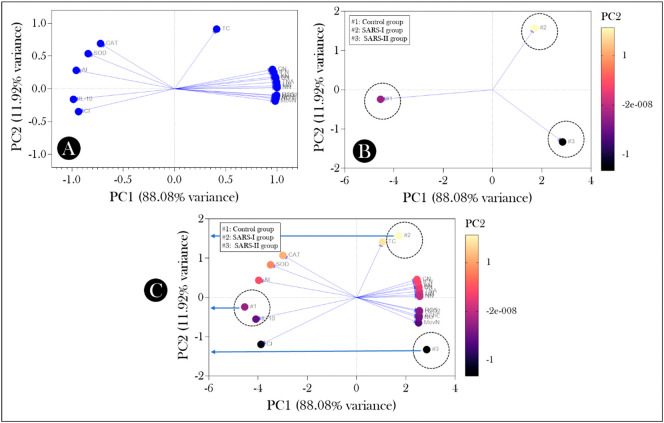
Fig. 7
(A) Loadings plot of the investigated variables, (B) PC score plot, and (C) PCA biplot of the first two principal components (PCs) that simultaneously shows scores of experimental groups. See the meanings of the acronyms in Table S1. In “C”, the blue arrows point to the PC2 Scores of the experimental groups. SARS-I and SARS-II: composite groups of zebrafish exposed to SARS-CoV-2 lysate protein at 0,742 and 2.226 pg/L, respectively.
Acknowledgments
This image is the copyrighted work of the attributed author or publisher, and
ZFIN has permission only to display this image to its users.
Additional permissions should be obtained from the applicable author or publisher of the image.
Full text @ Sci. Total Environ.