
Figure 3
- ID
- ZDB-IMAGE-230410-17
- Publication
- Vöcking et al., 2023 - A temporal single cell transcriptome atlas of zebrafish anterior segment development
- All Figures
- Figures for Vöcking et al., 2023
|
Figure 3
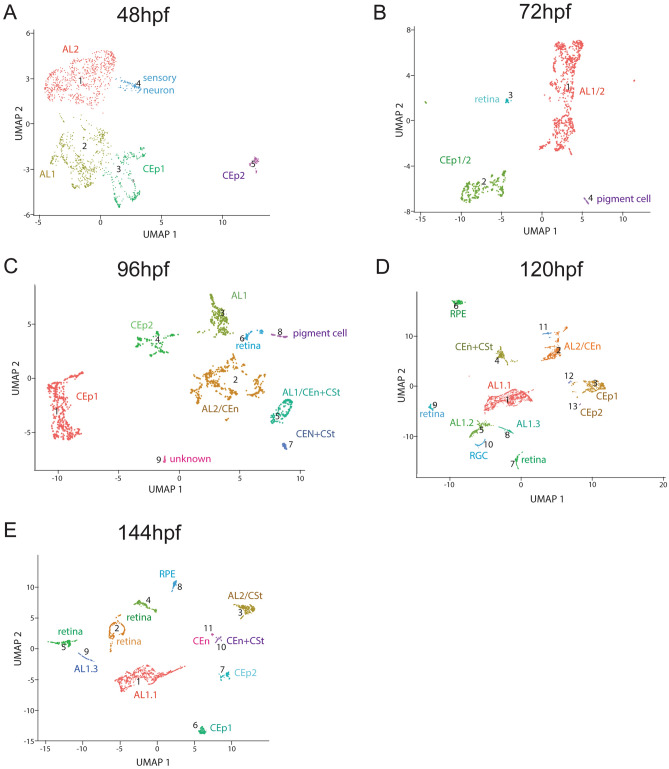
Clustering of purified ASM throughout early AS development. Cluster numbers are indicated in brackets. (A) Cluster distribution at 48 hpf. The five clusters observed were identified as: CEp1(2), CEp2(5), AL1(1), AL2(3) and sensory neurons(4). (B) Cluster distribution at 72 hpf. The four clusters observed were identified as: AL, CEp, retina and pigment cells. (C) Cluster distribution at 96 hpf. The nine clusters observed were identified as: CEp1(1), AL2/CEn(2), AL1(3), CEp2(4), AL1/CEn + CSt(5), retina(6), AL1/CEn + CSt(7), pigment cell(8), unknown(9). (D) Cluster distribution at 120 hpf. The fifteen clusters observed were identified as: AL1.1(1), AL2/CSt(2), CEp1(3), AL1/CEn + CSt(4), AL1.2(5), unknown(6), retina(7), AL1.3(8), retina(9), RGC(10), unknown(11). unknown(12), CEp2(13), unknown(14), unknown(15). (E) Cluster distribution at 144 hpf. The twelve clusters observed were identified as: AL1.1(1), retina(2), AL2/CEn(3), retina(4), retina(5), CEp1(6), CEp2(7), RPE(8), AL1.3(9), AL1/CEn + CSt(10), CEn(11), unknown(12).