
Figure 1
- ID
- ZDB-IMAGE-230410-15
- Genes
- Publication
- Vöcking et al., 2023 - A temporal single cell transcriptome atlas of zebrafish anterior segment development
- All Figures
- Figures for Vöcking et al., 2023
|
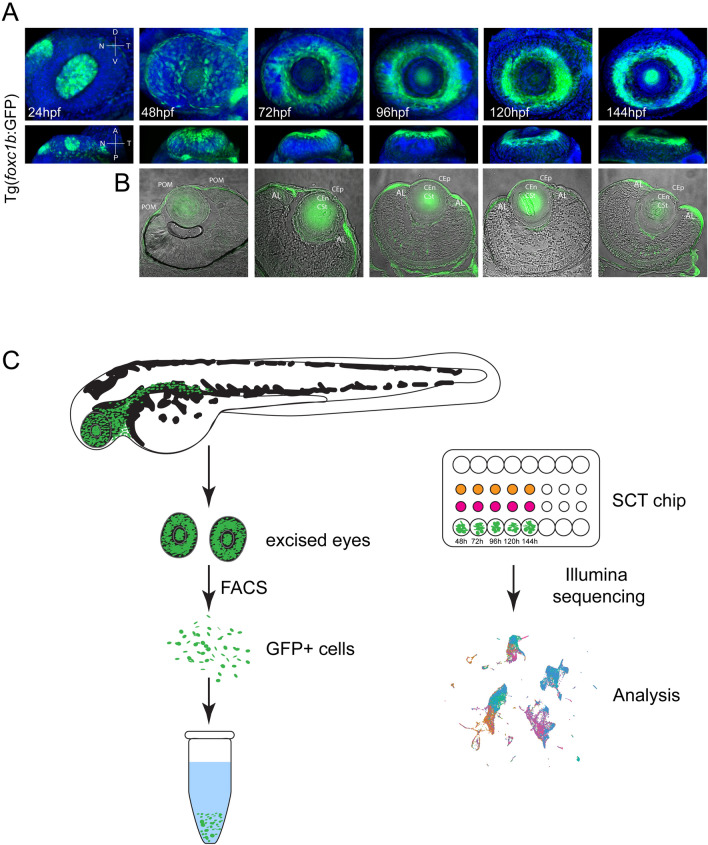
Figure 1
Strategy for generating ASM single cell transcriptomes over the course of early AS development. (A) Volume projections of ventral and dorsal views from 3D confocal stacks of whole mount Tg[foxc1b:GFP] embryos at 24, 48, 72, 96, 120 and 144 hpf. GFP+ cells (green) can be seen populating the AS regions by 48 hpf and assembling the typical doughnut like AS localization pattern from 72-144 hpf. DAPI (blue) was used to stain for nuclei. (B) Cryosections of Tg[foxc1b:GFP] embryos at 48, 72, 96, 120 and 144 hpf captured using confocal microscopy. GFP signal (green) is found in the AS regions in each of the time points. Transmitted light was used to capture tissue architecture. (C) Schematic for capture and subsequent assembly of single cell ASM transcriptomes. Dissected whole eyes were dissociated and GFP+ cells isolated using FACS. Subsequently single cells are captured using the 10X Genomics Chromium and the resulting single cell cDNA sequenced and analyzed.