
|
Fig 7
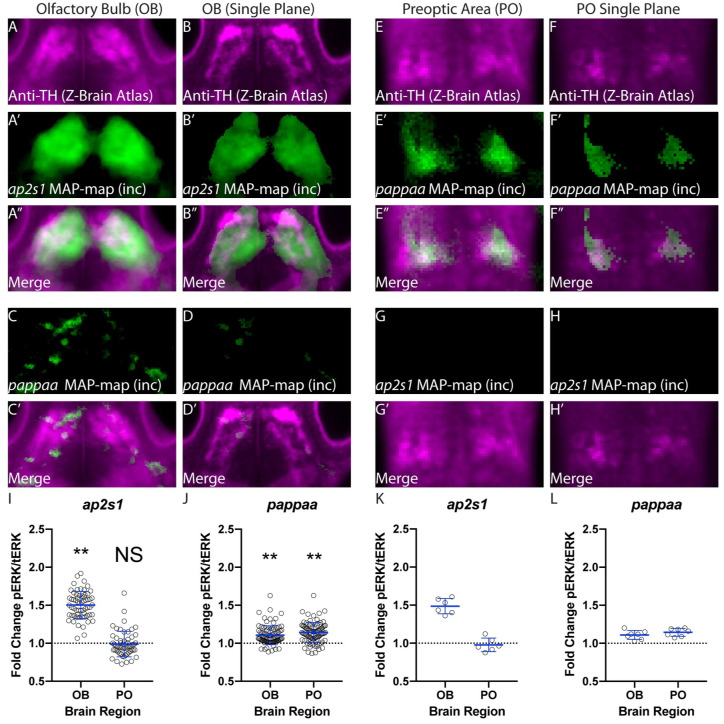
(A) Summed Z-projection of Th signal within the olfactory bulb obtained from the Z-brain Atlas [31]. (A’) Representative example of a summed projection from a single experiment showing regions of increased activity within the olfactory bulb in ap2s1 mutants relative to their siblings during habituation learning. (A”) A merge of A and A’ showing co-registration of Th-immunoreactive areas and regions of increased activity in ap2s1 mutants relative to siblings during habituation. Areas of increased activity in ap2s1 mutants during habituation learning show strong overlap with Th-immunoreactive olfactory bulb regions. (B) A single z-plane through the olfactory bulb Th-stained area shown in (A). (B’) The same z-plane as in B taken from the stack in A’ showing regions of increased activity within the olfactory bulb in ap2s1 mutants relative to their siblings during habituation learning. (B”) Merge of (B) and (B’). The x-y overlap indicated in