
|
Figure 5
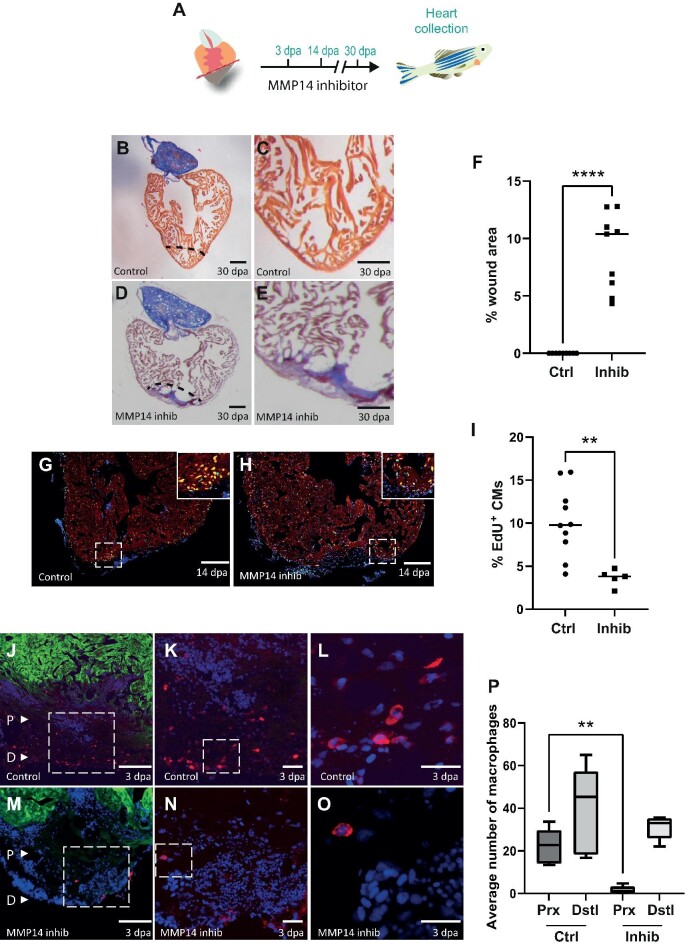
(Continued) (I) The graph indicates the percentage of EdU+ cardiomyocytes in the entire ventricle (control n = 10, inhibitor n = 5). (J–O) IHC on a 3 dpa control (J–L) or NSC405020-treated (M–O) zebrafish heart section for cardiomyocytes (GFP, green) and macrophages (IB4, red). (J and M) The letter P and the white arrow head point to proximal regions where macrophages were counted. The letter D and the white arrow head point to distal regions where macrophages were counted. Scale bar, 200 μm. (K and N) The regions highlighted by the dashed white box in J and M are magnified, respectively, which show macrophages in the wound region. Scale bar, 20 μm. (L and O) The regions highlighted by the dashed white box in K and N are magnified, respectively. Scale bar, 20 μm. (P) The graph indicates the average number of macrophages counted in either the proximal (Prx) or distalP-values were calculated using a non-parametric Mann–Whitney test. *P < 0.1, **P < 0.01, ***P < 0.001, ****P < 0.0001.