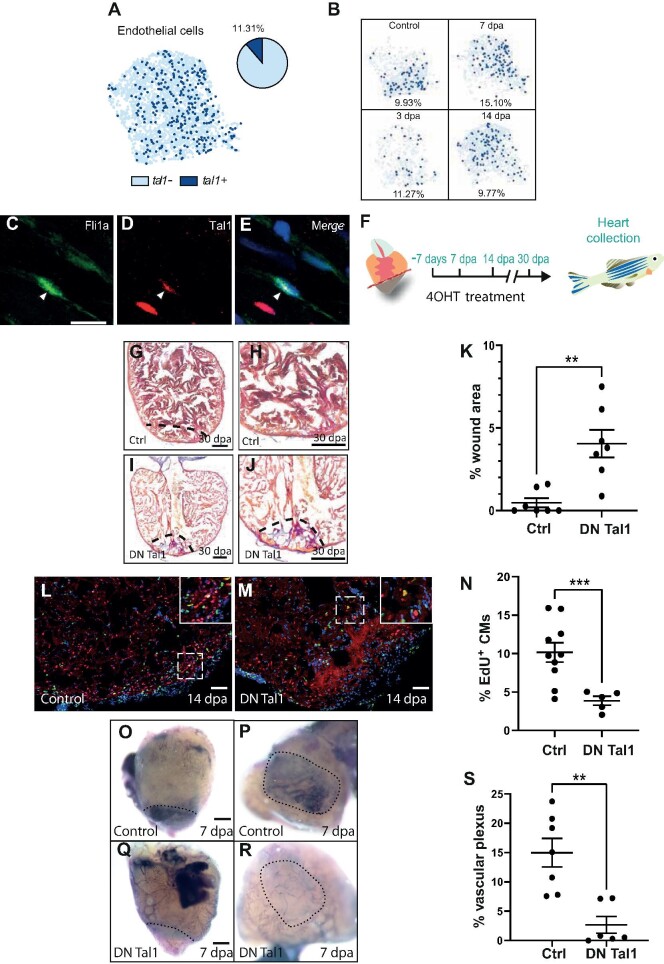
IMAGE

Figure 3

ID
ZDB-IMAGE-230406-85
Source
Figures for Rolland et al., 2022
Image
Figure Caption

Figure 3

(Continued) (GJ) AFOG staining of a control (G and H) or DN Tal1-expressing (I and J) heart at 30 dpa. The black dashed line indicates the plane of amputation. The same images are shown in H and J at higher magnification, respectively. Note the presence of a large fibrin (red)/collagen (blue) scar. Scale bar, 200 μm. (K) The graph indicates then = 7, DN Tal1 n = 7). (L and M) EdU labelling of cycling cardiomyocytes in a control (L) or DN Tal1-expressing (M) heart. MEF2/cardiomyocytes (red), EdU (green). The dashed white box indicates the area shown at higher magnification in the inset. Scale bar, 100 μm. (N) The graph indicates the percentage of EdU+ cardiomyocytes in the entire ventricle (control n = 10, DN Tal1 n = 5). CMs, cardiomyocytes. (OR) Alkaline phosphatase staining of the regenerating vascular plexus in a control (O and P) or DN Tal1-expressing (Q and R) heart. The same hearts viewed dorsally at higher magnification are shown in P and R, respectively. The black dashed line indicates the wound/myocardium border (O and Q) or wound region (P and R). Scale bar, 200 μm. The reduced alkaline phosphatase staining indicates that the vascular plexus has failed to regenerate normally. (S) The graph indicates the average area of the vascular plexus as a percentage of the entire wound region (control n = 7, DN Tal1 n = 6). P-values were calculated using a non-parametric Mann–Whitney test. *P < 0.1, **P < 0.01, ***P < 0.001, ****P < 0.0001; DN, dominant negative.

Acknowledgments
This image is the copyrighted work of the attributed author or publisher, and ZFIN has permission only to display this image to its users. Additional permissions should be obtained from the applicable author or publisher of the image. Full text @ J. Mol. Cell Biol.