
|
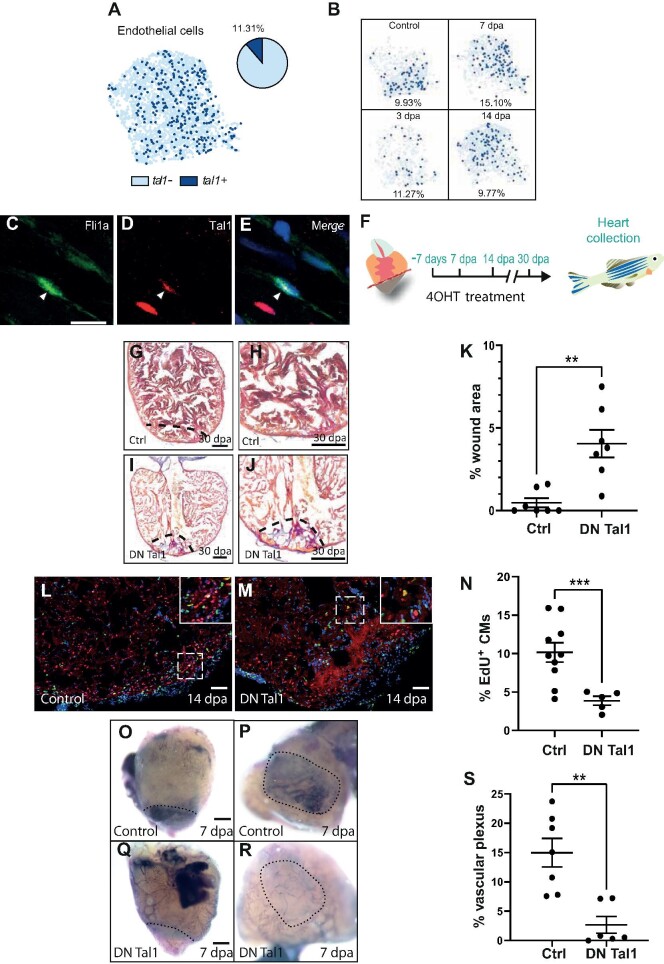
Figure 3
Tal1 is a regulator of the endothelial regenerative response. (A) UMAP plot of the endothelial cell cluster (light blue dots) shows that tal1 is expressed in a subset of these cells (dark blue dots). The pie chart indicates the total proportion of endothelial cells that express tal1. (B) UMAP plots of the endothelial population at different stages of regeneration (control/unamputated, 3 dpa, 7 dpa, and 14 dpa). The proportion of tal1-expressing endothelial cells (dark blue dots) is given as a percentage underneath each UMAP plot. (C–E) IHC analysis of endothelial cells. Fli1a+, green (C); Tal1+, red (D); a merged image (E). Scale bar, 10 μm. (F) Schematic of the 4OHT treatment.