
Fig 8
- ID
- ZDB-IMAGE-230406-76
- Publication
- Hong et al., 2023 - Essential role of an ERV-derived Env38 protein in adaptive humoral immunity against an exogenous SVCV infection in a zebrafish model
- All Figures
- Figures for Hong et al., 2023
|
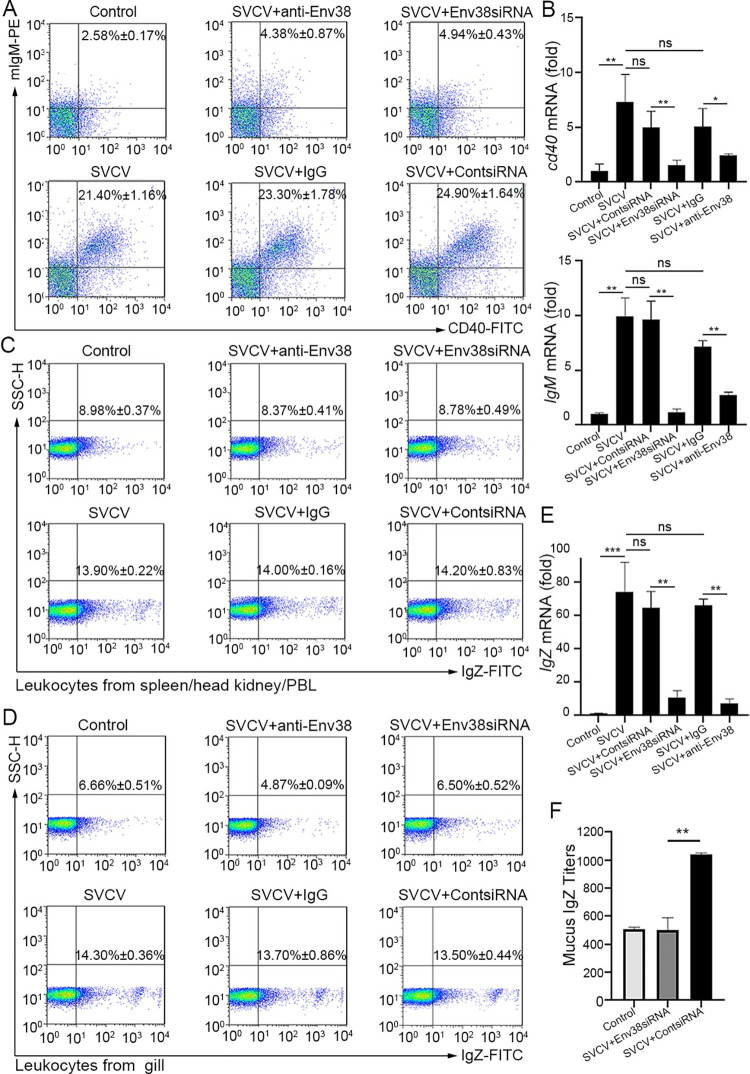
Fig 8
(A and B) In vivo examination on the activation of IgM+ B cells of zebrafish stimulated with SVCV (105 TCID50) and impaired by blockade or knockdown of Env38 with i.p administering anti-Env38 Ab (10 μg/fish) or Env38siRNA-LV (1×10⁶ TU/fish) as determined by the percentage of mIgM+CD40+ B cells with mouse anti-mIgM (1:2,000) and rabbit anti-CD40 (1:500) through FCM analysis (A) and the transcriptional expression levels of cd40 and IgM genes through RT-qPCR (B). (C-F) In vivo examination on the activation of IgZ+ B cells of zebrafish stimulated with SVCV (105 TCID50) and impaired by blockade or knockdown of Env38 with i.p administering anti-Env38 Ab (10 μg/fish) or Env38siRNA-LV(1×10⁶ TU/fish) as determined by the percentage of IgZ+ B with rabbit anti-IgZ (1:500) in leukocytes from spleen, head kidney and peripheral blood (C) and from gill (D) through FCM analysis, the transcriptional expression of IgZ genes via RT-qPCR (E) and the mucus IgZ antibody production by ELISA (F). Nonrelated control groups were administered with isotype IgG or scrambled siRNA-LV. Negative control groups received mock PBS. The data presented in each block diagram indicated the average percentage of IgM+CD40+B or IgZ+ B cells in each treatment group. RT-qPCRs were run in combination with the endogenous β-actin control. Error bars represented SEM. (*p < 0.05; **p < 0.01; ***p < 0.001; ns, no significant difference).