
|
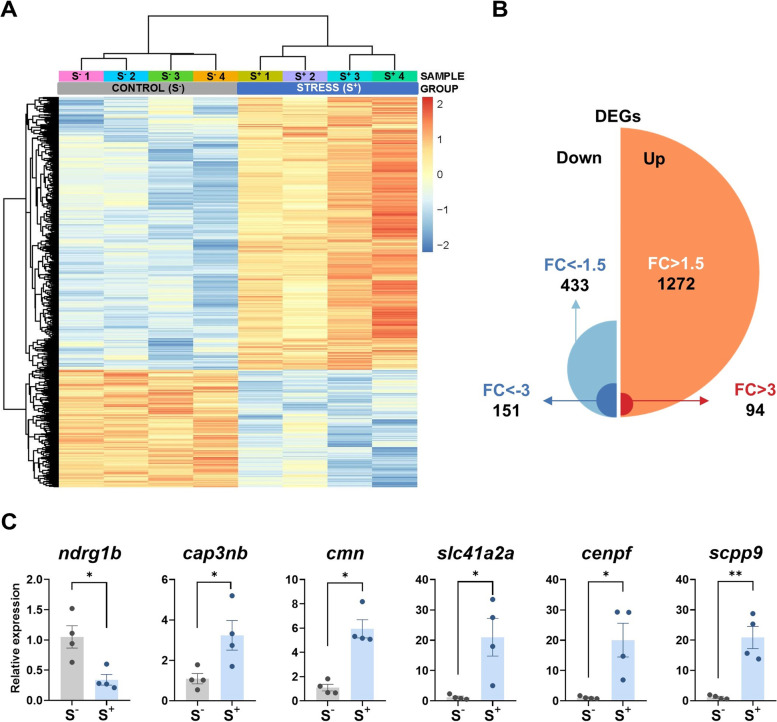
Fig. 7
RNA-seq analysis of zebrafish 7-dpf larvae (control and stressed). Stressed progenies (S+) were obtained from a control female crossed with a male exposed to the 21-day CS protocol. Control progenies (S−) derived from a control unexposed male crossed with a control female. A Heatmap generated by unsupervised hierarchical clustering of RNAseq expression z-scores computed for the 1705 differentially expressed genes (DEGs) (cut-off criteria: p. adjusted < 0.0500; |FC| > 1.5) between S− and S+ larvae. The heatmap was generated with the “pheatmap” R package (https://CRAN.R-project.org/package=pheatmap) (n = 4 progenies/treatment). B Representation of the 1705 DEGs (S+ vs S−) detected by RNA-seq passing the stablished threshold identifying the number of upregulated and downregulated DEGs and classifying them by their FC. C Normalized gene expression obtained in the qPCR validation assay for the RNA-seq. Data in C are shown as mean ± SEM (*p < 0.0500; **p < 0.0100)