
Image
|
Figure Caption
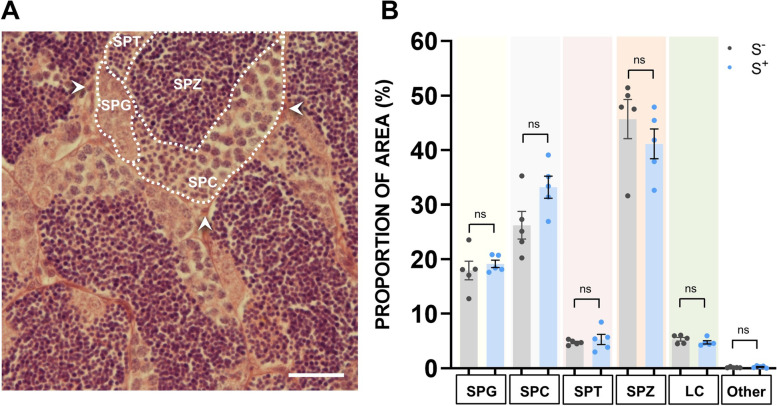
Fig. 3
Histological analysis. A Representative H&E histological field of testes sections from S− and S+. SPG, spermatogonia; SPC, spermatocytes; SPT, spermatids; SPZ, spermatozoa; LC, Leydig cells; Other, other cell types. Scale bar: 25 μm. B Quantitative analysis of spermatogenesis. Proportion (%) of area occupied by cells in S− and S+. S−: control males. S+: males exposed to the CS protocol. Data are presented as mean ± SEM (n = 5; fish batch 2)
Acknowledgments
This image is the copyrighted work of the attributed author or publisher, and
ZFIN has permission only to display this image to its users.
Additional permissions should be obtained from the applicable author or publisher of the image.
Full text @ BMC Biol.