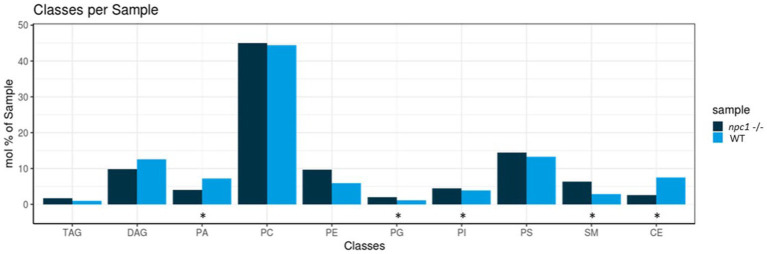
Image


                        Figure Caption


Figure 11
Lipidomic analysis of 10 different lipid classes: TAG (triacylglycerol), DAG (diacylglycerol), PA (phosphatidate), PC (Phosphatidylcholine), PE (phosphatidylethanolamine), PG (phosphatidylglycerol), PI (phosphatidylinositol), PS (phosphatidylserine), SM (sphingomyelin) and CE (cholesteryl esters) between wt (healthy) and npc1−/− (disease) revealed statistically significant percentage differences in PA (value of p = 0.036), PG (value of p = 0.0055), PI (value of p = 0.038), SM (value of p = 0.002), and CE (value of p = 0.02). Statistically significant data in the graphs is indicated with a *.
                
                    
                        Figure Data


                        Acknowledgments


This image is the copyrighted work of the attributed author or publisher, and
ZFIN has permission only to display this image to its users.
Additional permissions should be obtained from the applicable author or publisher of the image.
      Full text @ Front. Mol. Neurosci.


        