
Image
|
Figure Caption
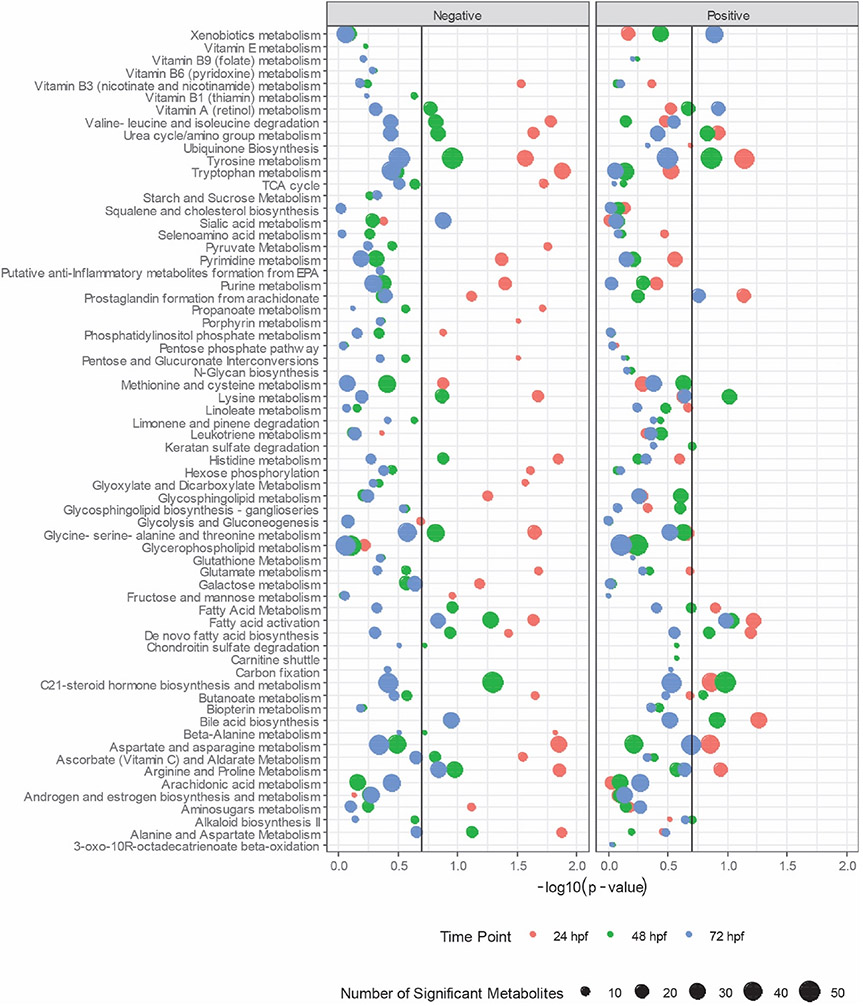
Fig. 5
Enriched pathways associated with the 10 ppb TCDD exposure group. Results are shown for pathways that had at least 5 significant metabolites in both the negative and positive ionization mode . The size of the dot represents the number of overlapping metabolites in the pathway. The position of the dot is determined by the -log p-value obtained from 10,000 permutations. The black vertical line indicates significance
Acknowledgments
This image is the copyrighted work of the attributed author or publisher, and
ZFIN has permission only to display this image to its users.
Additional permissions should be obtained from the applicable author or publisher of the image.
Full text @ Chemosphere