
Image
|
Figure Caption
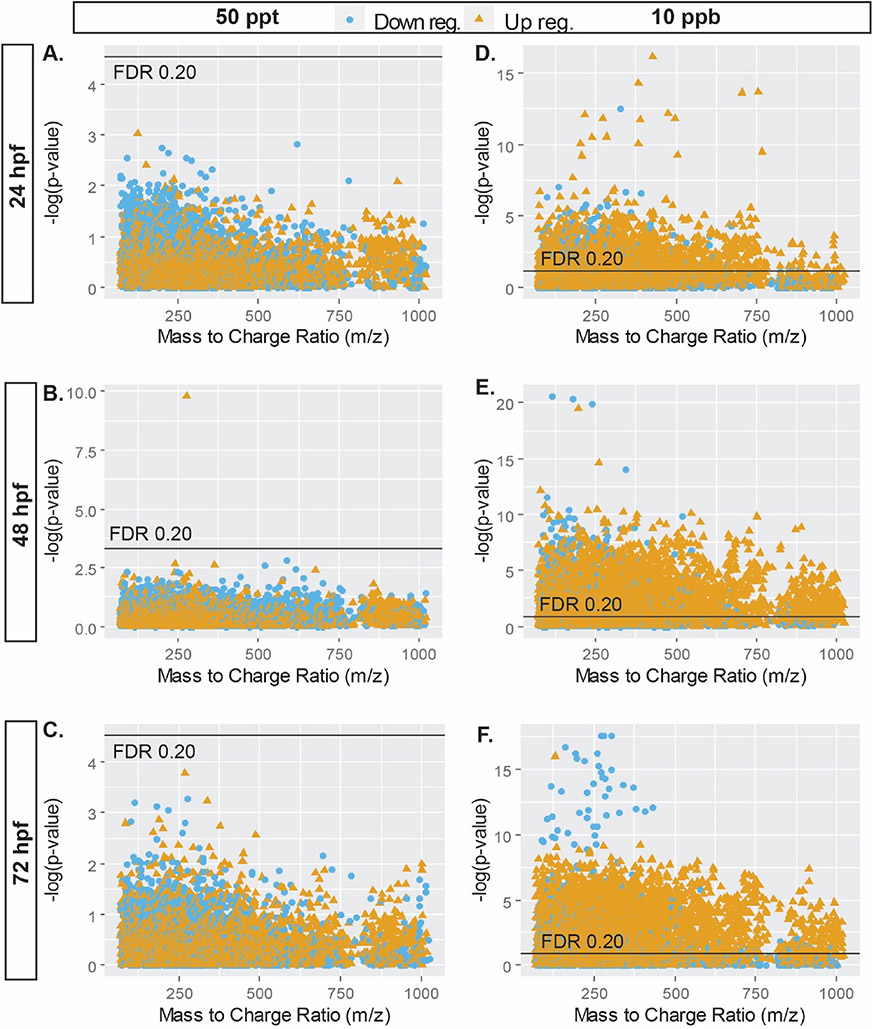
Fig. 3
Manhattan plots of positivelog10 transformed p-values describing the association between m/z features and the 50 ppt TCDD exposure (A, B, & C) as well as the 10 ppb TCDD exposure (D, E, & F) at 24, 48, and 72 hpf. . Blue circles represent features that were downregulated in comparsion to the control group, whereas orange triangles represent features that were upregulated . The black line indicates the p-value corresponding to a false discovery rate (FDR) threshold of 0.2.
Acknowledgments
This image is the copyrighted work of the attributed author or publisher, and
ZFIN has permission only to display this image to its users.
Additional permissions should be obtained from the applicable author or publisher of the image.
Full text @ Chemosphere