
|
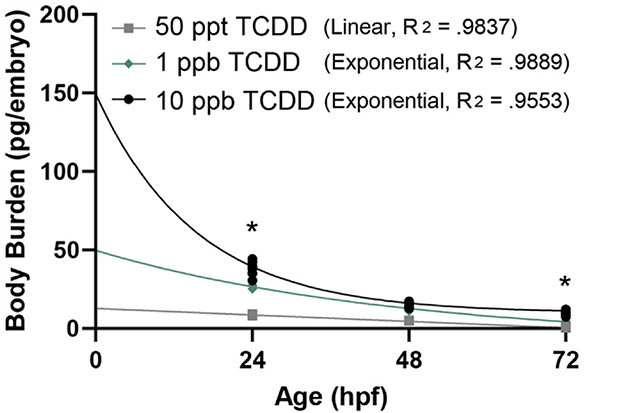
Fig. 1
Change in embryonic TCDD concentration over time. Zebrafish were exposed to either a 50 ppt (grey boxes), 1 ppb (green dimonds), or 10 ppb (black circles) solution of TCDD for 1 hour at 4 h post-fertilization (hpf). Samples were fixed at 24, 48, and 72 hpf and TCDD was quantified at each time point. The 10 ppb and 1 ppb exposures were best modeled by exponential decay while the 50 ppt was best described by linear elimination. The asterisk (*) denotes a statistically significant difference between the 10 ppb and 1 pbb exposure groups (t-test). At 24 and 72 hpf, there was significantly more TCDD present per embryo in the 10 ppb exposure group (p = 0.1167 and p = 0.0001) when compared to the 1 ppb exposure group.