
|
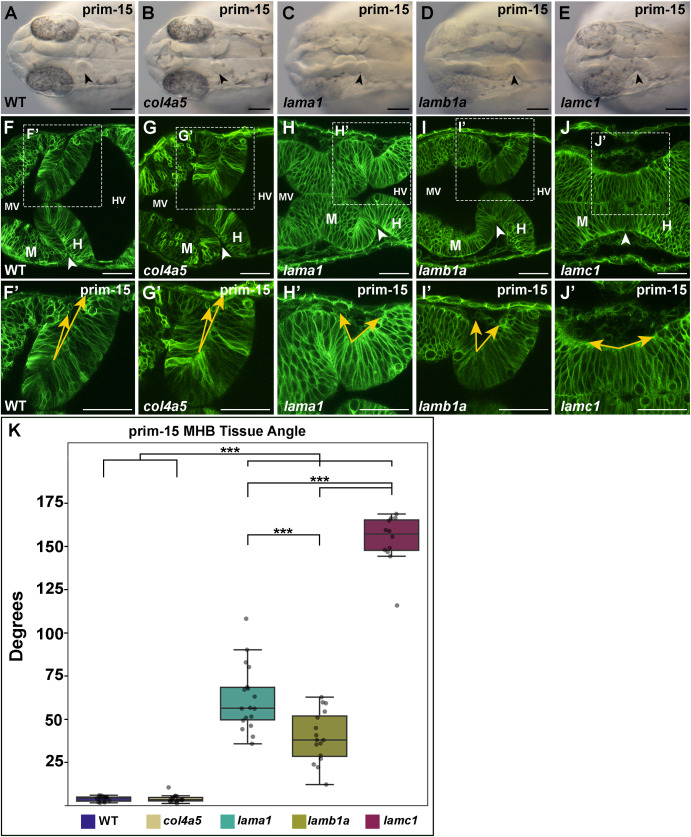
Fig. 8 Examination of the MHB at prim-15 highlights a differential capacity for basal tissue folding between lama1, lamb1a, and lamc1 mutants. (A–E) Representative dorsal brightfield images of embryos at prim-15, WT (A) and col4a5 (B), lama1 (C), lamb1a (D), and lamc1 (E) mutants. (F–J) Representative confocal images of embryos injected with memGFP and imaged at prim-15, WT (F) and col4a5 (G), lama1 (H), lamb1a (I), lamc1 (J) mutants. (F′-J′) Regions outlined by the dashed white boxes from F-J to visualize MHB angle. Yellow arrows along the basal edge of the tissue are representative of angle measurements. (K) Quantification of MHB angle at prim-15. Boxplots indicate the 25th and 75th percentiles and the median. At least three independent experiments are represented. n = 7 embryos for WT, 8 embryos for col4a5 mutants, 9 embryos for lama1 mutants, 8 embryos for lamb1a mutants, and 6 embryos for lamc1 mutants. Significance values ∗∗∗P < 0.005. Anterior to the left and posterior to the right in all images. Arrowheads indicate MHBC. M, midbrain; H, hindbrain; MV, midbrain ventricle; HV, hindbrain ventricle. Scale bars: (A–E) 100 μm, (F–J) 50 μm, (F′-J′) 50 μm.
Reprinted from Developmental Biology, 492, Falat, E.J., Voit, G.C., Gutzman, J.H., Laminin-111 mutant studies reveal a hierarchy within laminin-111 genes in their requirement for basal epithelial tissue folding, 172-186, Copyright (2022) with permission from Elsevier. Full text @ Dev. Biol.